Our customers keep telling us that safe rollouts with feature flags have transformed their business. Today’s development and IT teams are testing changes in production, spinning up beta programs on the fly, and turning off problematic code with the click of a button. They are saving on infrastructure costs while getting code out faster and more safely, and Split is at the center of this revolution. But feature flags aren’t the end of the story. The question remains: how do I know that there’s a problem with the code I just released?
Split’s feature monitoring allows your team to be alerted whenever it detects an issue in a release. Compared to traditional monitoring solutions, Split can identify problems even during the smallest ramps and tell you exactly where the problem is rather than requiring your team to debug the issue before remediation. Split uses statistics to avoid false positives and prevent alert fatigue, removing the typical process of tuning alert policies. Every alert policy in Split runs automatically for all feature releases, so the only thing your teams need to do is respond when they learn of an issue.
Feature monitoring from Split requires four steps; tracking the underlying events, defining the metric to aggregate those events, configuring when the notification should fire, and finally having an incident occur. In this post, we will walk you through all four!
Tracking Events
Within Split, a metric represents a measurement over the set of events a given unit of traffic (such as a user) generates after seeing a Split. The metric may measure if the user ever experienced the event, how many the user fired, or the total or average value associated with the event. To build a metric, we first need to add code to your system to track when the events occur. Here we will show you how to send events to Split directly, but we also offer various integrations and APIs for collecting events data.
For those getting started, the first metric we recommend starting with is tracking exceptions in your client. Any unexpected issue can throw an exception, whether due to invalid user input, a bug in client-side logic, or a failure response from the server-side API. Another advantage is that for JavaScript, at least, tracking exceptions is incredibly easy to add!
For those already using Split for feature flags, your initialization of the JavaScript client may look something like this:
var factory = splitio({
  core: {
    authorizationKey: "<your api key>",
    trafficType: "user", // type of traffic identified
    key: "user_id", // unique identifier for your user
  },
});

var client = factory.client();This code simply initializes the client with the relevant API key and the user’s identifier currently on your page. This identifier can be for a user, session, device cookie, or any other field that you use to randomize your rollouts.
After initializing the Split client, we can immediately configure our exception tracking!
var key = "user_id";

var factory = splitio({
  core: {
    authorizationKey: "<your api key>",
    trafficType: "user", // type of traffic identified
    key: "user_id", // unique identifier for your user
  },
});

var client = factory.client();

window.addEventListener("error", function (event) {
  client.track("exception", {
    url: document.location.href,
    sdk: "javascript",
    message: event.message || event,
  });
});This tracking provides simple feedback to Split whenever an exception occurs. Note that Split also provides the ability to enrich events with additional context through properties. In this case, we are supplying the URL, the SDK used, and the error message. Also, consider including the location of the error in the code (pulled from the stack trace) or a section category to reference the part of the site where the user encountered the issue (for example, search, product, settings, home, etc.). This context helps build more focused metrics around these exceptions, and your team can use the events stream to help debug any issues identified by Split.
You can test this behavior out now in this sandbox; all you need is a client-side API key from the Split UI to enter into the JavaScript. This sandbox application will instantiate the Split SDK as described above and implement the exception tracking, with a dedicated button for triggering those exceptions. With Split’s live tail, you can watch those exception events as they are received. We will revisit this sandbox later to test the alert policy once it is in place.
Defining the Metric
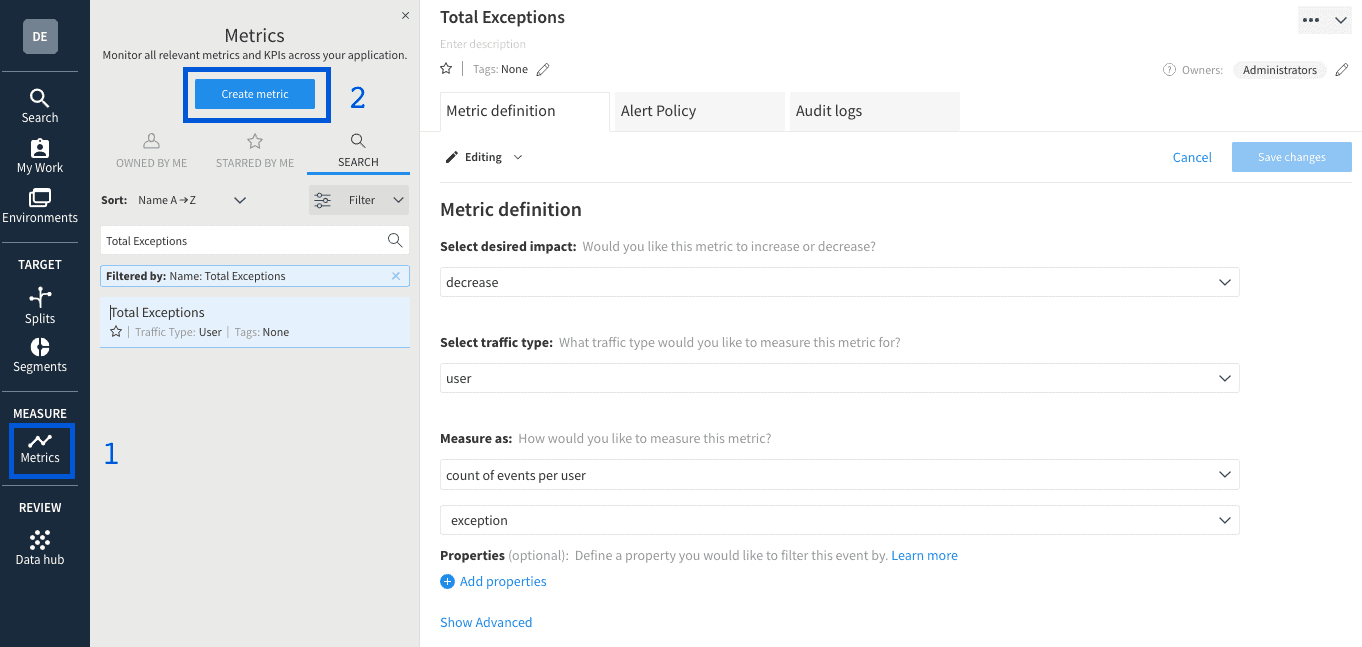
For our monitoring metric, we will measure the overall exception frequency amongst your users. This metric will identify an increase in exceptions relative to the baseline user experience. A note on creating metrics — event types are only available in the metrics creator once we have received at least one event of that type. We provide this sandbox for testing the event tracking, which also creates the event type before deploying it in your code. With that exception event type, we can now define the metric. To set up this metric in the Split UI, follow the navigation indicated with blue rectangles below to reach the creation form.

To create a metric in Split, we ask three questions:
1. Would you like this metric to increase or decrease?
As uncaught exceptions represent a problem occurring in the code, any product will try to decrease the number of exceptions that occur. Our alerts will send a notification when a feature impacts the metric in the opposite direction, thus alerting us if a change causes exceptions to rise.
2. What traffic type would you like to measure?
The scale, meaning, and relevance of any metric are different based on the type of traffic it measures. For instance, the total time on site will be far higher per user than per session, and the number of sessions per user is valuable, but sessions per session would be meaningless. For exception rate, we have set this to “user,” but we recommend configuring this metric for all traffic types your team uses to manage their releases.
3. How do you measure this metric?
The Total Exceptions metric measures the count of exception events per user. This data is analyzed on a per-user basis, allowing Split to determine how the number of exceptions varies from user to user. That variability then informs Split whether the difference between the feature treatment and the baseline is significant given how much the metric fluctuates.
Alert Policy
Establishing the Alert Policy for this metric will notify your team if a significant degradation occurs. The Alert Policy tab is right next to the Metric definition on the metric page and allows you to define one or more conditions that will notify your team. The description field is an opportunity to guide your team on how to respond to an alert. Typically, the best response to an issue with a feature is to ramp down or kill the split and then investigate the underlying issue, allowing you to remediate the problem as quickly as possible. Split’s feature monitoring supports separate alert lists for each environment or effect magnitude. You may choose to notify stakeholders in the staging environment with a simple email, but production issues may require firing the alert directly to your paging system’s email address.

For this metric, we define a simple policy that will alert both the metric owner and the problematic split’s owners if any issue is detected. Note that while the configuration will alert on a degradation greater than 0%, Split will only alert if the detected degradation is outside of normal variance, thus minimizing the noise that can often occur with alerting engines. Depending on the metric, you may wish to alert only if the magnitude of change is beyond a particular threshold, such as if the conversion rate drops by more than 5% relative to the baseline or if page load times increase by an absolute difference of 500 milliseconds. To better understand how the threshold will change the alerting sensitivity, refer to the alert policy sensitivity calculator in our help center.
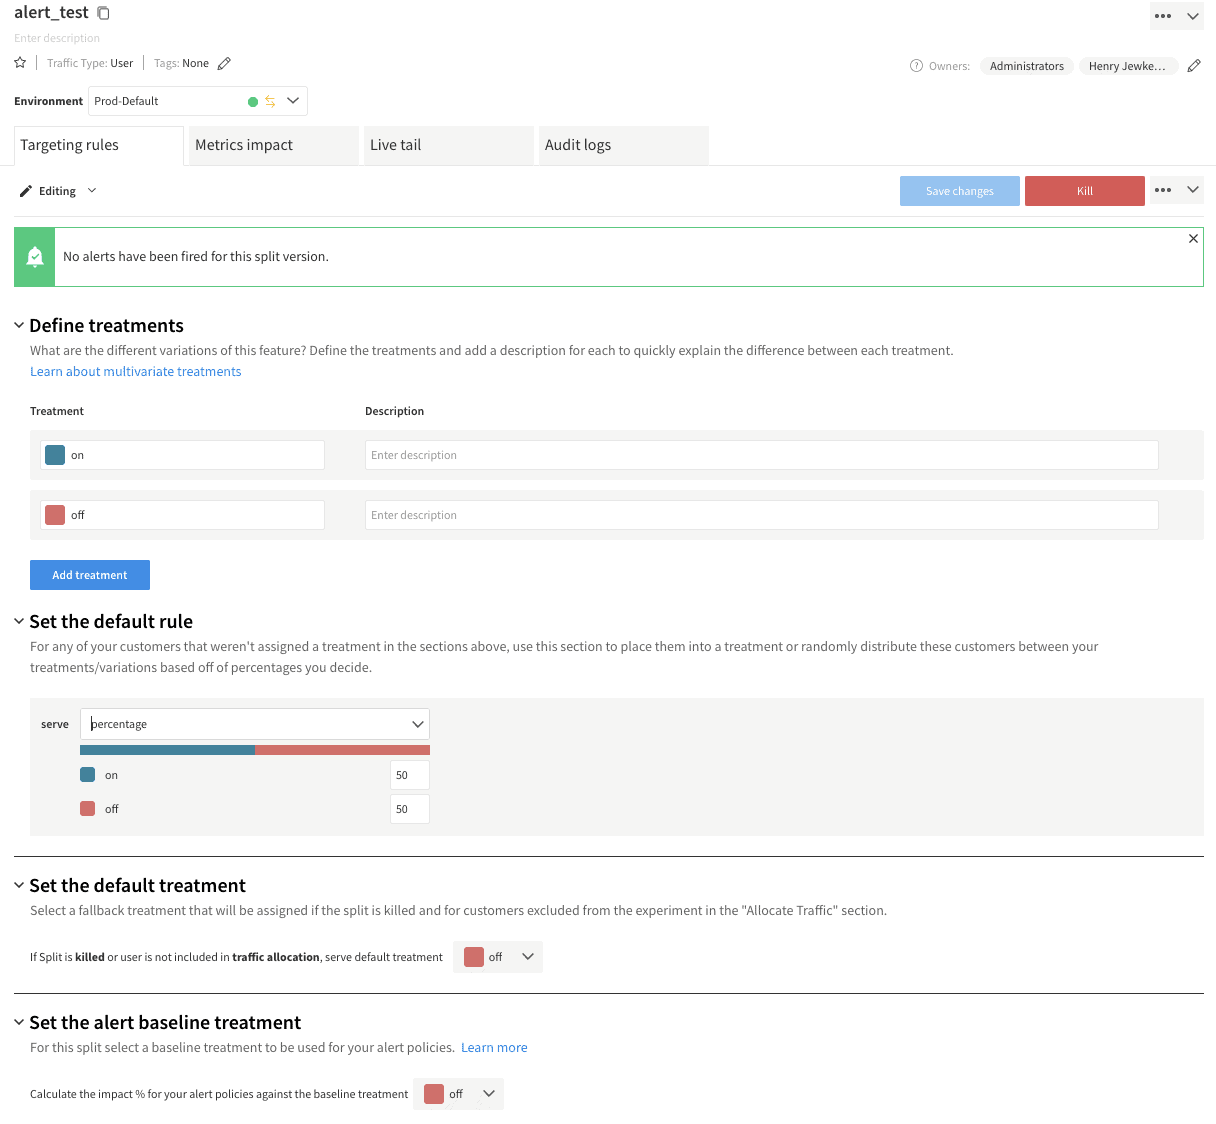
With the alert policy in place, Split will now evaluate this policy against every feature release, which serves a random percentage of users. Randomization is necessary to attribute the issue to the feature changed. Without it, the difference measured may simply be inherent to the groups targeted by each rule (for example, turning a split on in Asia may yield lower page load times just due to their distance from your servers). The alert baseline treatment matches your split’s default treatment by default but is editable based on that release’s needs. For additional information, such as configuring the monitoring settings or seeing the alerts that have fired for a split, please refer to the feature monitoring documentation or our in-depth overview video.
Test the Alert
Monitoring platforms exist to identify and alert if an issue occurs, but that often means waiting for a problem to know whether you configured the alert correctly. With Split, we will test this alert right now by simulating 1000 users worth of traffic.
To run this test, we first need to create the “alert_test” split by following our documentation. This test will use the standard on/off treatments and a simple 50% rollout plan for allocating traffic.

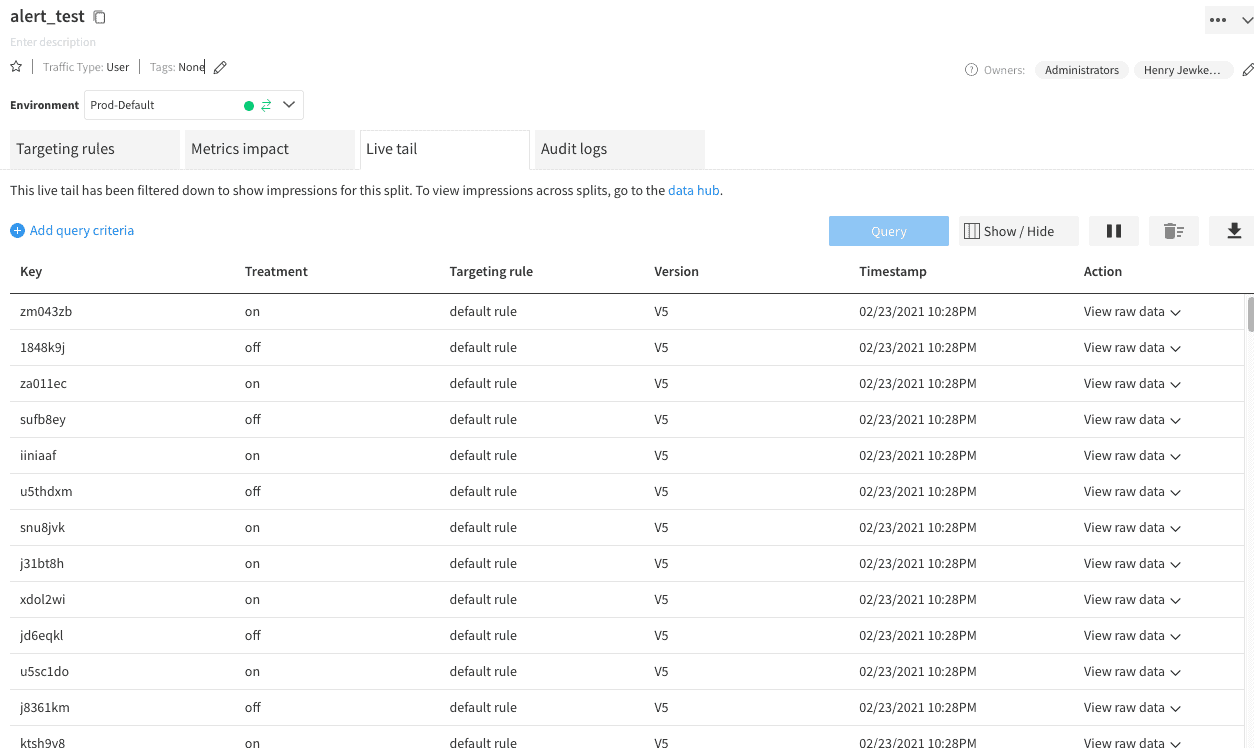
With the Split configured, we can return to the exception tracking sandbox from earlier. The “Cause Alert” button is tied to the corresponding causeAlert function and will initialize a split client for 1000 randomly generated keys. Each client calls the “alert_test” split and sends an exception event based on the treatment returned. In this case, we are using 5% for the “on” treatment and 1% for the “off.” We chose these error rates arbitrarily for demonstration purposes; for most production applications, the baseline error rate is likely lower than 1%. When an issue does occur, it is common for it to impact far more than 5% of the users exposed to that code. Feel free to configure those error rates to see how it changes the data in Split. After setting the API key to the correct client-side key for the split you created, we can start a query on the Live Tail for the Split to watch the impressions roll in when you click “Cause Alert” in the sandbox.

Split’s feature monitoring will process the received data regularly and monitor for issues at any point in the feature rollout, whether it has been running for five minutes or five days. The alert will send an email to your Split user’s account and surface in the Metrics Impact tab’s Alerts section.

Learn More About Hypothesis-Driven Development and Experimentation
By following these steps, you have given Split the ability to alert the owners of any feature that increases the rate of JavaScript exceptions for your users. Whether a team is rolling out a feature flag or running an experiment, they will have an additional safety layer with every release. While this article focused on tracking JavaScript exceptions, Split can monitor for any issue; from mobile application crashes to increased server load to slow page load times. From here, you can progress into tracking and alerting on essential business metrics. These can include conversions or revenue, which are less common for engineering teams to be aware of but can be far more detrimental to the business. Such tracking follows the same pattern described here; for more information on the types of metrics you can track, please visit our Metrics Reference, or reach out to support@split.io to set up a consultation with one of our Experimentation Advisors.
Ready to learn more? Check out these resources!
- Documentation
- Videos
- Blog
Get Split Certified
Split Arcade includes product explainer videos, clickable product tutorials, manipulatable code examples, and interactive challenges.
Switch It On With Split
The Split Feature Data Platform™ gives you the confidence to move fast without breaking things. Set up feature flags and safely deploy to production, controlling who sees which features and when. Connect every flag to contextual data, so you can know if your features are making things better or worse and act without hesitation. Effortlessly conduct feature experiments like A/B tests without slowing down. Whether you’re looking to increase your releases, to decrease your MTTR, or to ignite your dev team without burning them out–Split is both a feature management platform and partnership to revolutionize the way the work gets done. Switch on a free account today or schedule a demo to learn more.
