Review: Feature Flags For Control of Code Rollouts
In my last post and video, I cleared up some confusion between the general idea of configuration flags and the specific pattern of using feature flags to decouple deployment from release.
The main point in What’s The Difference Between Feature Flags and Other “Flags” in Software Engineering? was that feature flags give you control over the exposure of a feature on a user-by-user and session-by-session basis. Whether you want to keep code dark because it’s not finished, roll it out internally for some dogfooding, or manage a gradual rollout to all of your customers, a solid feature flag solution provides a standardized, scalable and transparent way to accomplish that across all of your projects.
Today: So, How Do You Know Your Rollout Is OK?
But how do you know if your rollouts are OK and should be ramped up or are surfacing issues that need to be fixed before you turn up the dial? That’s the focus of today’s post and video. Whether you prefer to read or watch, I’ve got you covered. Let’s jump in!
A Critical Capability, Right Up There With Version Control and Continuous Integration
At QCon New York and GOTO Chicago, I gave talks about how Booking.com, LinkedIn and a few other internet giants have built amazing in-house systems for control and observation with feature flags. What these teams have discovered (and bet significant tooling resources on) is that building-in fine-grained control and automated observability into their continuous delivery practices is as critical as maintaining version control or implementing continuous integration.
I spent most of my time at those shows chatting with senior developers, team leads and architects who had been coding and designing for years. If I met you there, thanks for sharing your stories!
I didn’t keep detailed stats, but I’d say that about half of the people I spoke with were just getting exposed to feature flags and the other half were already using them for selective rollouts.
Wait. What? You’re Winging It?
What struck me wasn’t that only about half of the folks I spoke with had a mechanism for targeted rollouts based on feature flags, but that only one of those teams had a structured and repeatable way to tell how the rollouts were going. Everybody else was just winging it with ad-hoc exploration and/or waiting for some global health metric to go yellow or red.
OK, “winging it” may be a little strong. I don’t mean you don’t care. I do mean that ad hoc poking around is way too random and inconsistent and way too dependent on favors and subject to observer bias. Bottom line: it’s way riskier than it needs to be.

This isn’t rocket science: the point of doing gradual rollouts, or targeted experiments, is to get some feedback about whether new code accomplishes some goal (like increasing user engagement or selling more widgets) without negatively impacting other things you care about (like response time, errors, resource consumption, unsubscribes, bad app reviews, etc…).
Does Your New Code Make Any Difference?
If I send 10% of my users some new functionality and I hold off on having the other 90% see that functionality, (or go through some new back-end algorithm), I want to be able to reliably determine the differences in user experience, including response time, error rates and app crashes between those two groups. I also want to know which users are doing more of the things that make my business thrive and grow.

Track The Impact in High Resolution
Auto-calculating impact metrics is the idea of using the same system that it’s controlling the rollout to keep track of how well it’s going, and to do that in a way that is repeatable, consistent and scalable (none of which you get from ad-hoc scrambles and favors). The inputs to this process can come from anywhere and can be a mix of existing and new instrumentation. The key is to use the lens of the control plane (the thing deciding who gets what code) to observe how it’s going.
In addition to consistency, watching each cohort through this lens makes it much easier to get an early warning (or early good news) than if you watch your global metrics. Here’s why: if I send 10% of the users this way and 90% of the users that way, my global metrics are only likely to surface a symptom if the impact is catastrophic or fantastically positive. Literally, my good or bad symptoms would have to be 10x what is practically significant to me in order to show up in global stats. But, if I focus my observations on the 10% and 90% separately and then compare the two, the differences will pop out in high resolution.
This Is Doable. Crawl. Walk. Run. (Some Fly!)
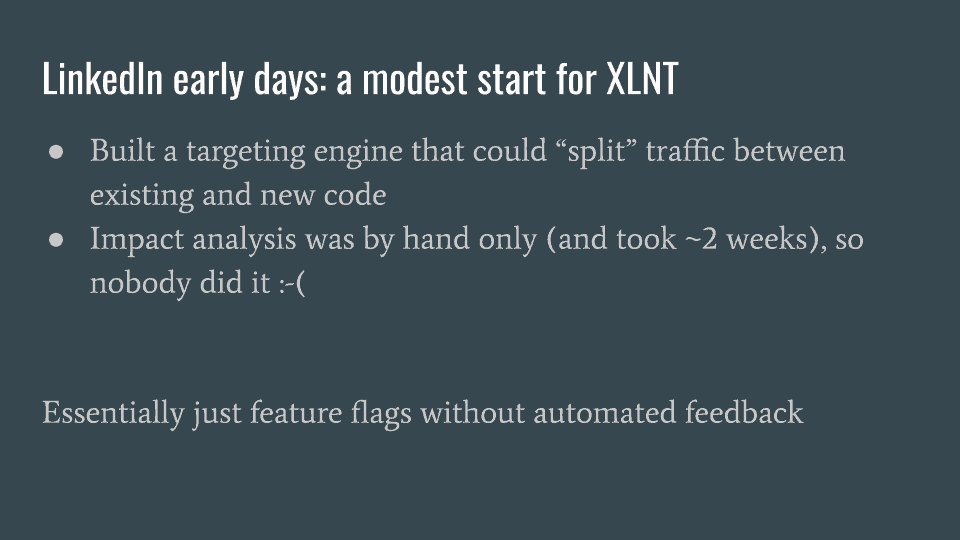
Each of the systems I reviewed in my talks at GOTO and QCon have the ability to automatically report on impacted metrics. They didn’t build that overnight. LinkedIn started with a feature flagging system that required manual calculation of metrics. That process involved begging favors from a data scientist and took about two weeks, so by their own admission, they almost never did it.

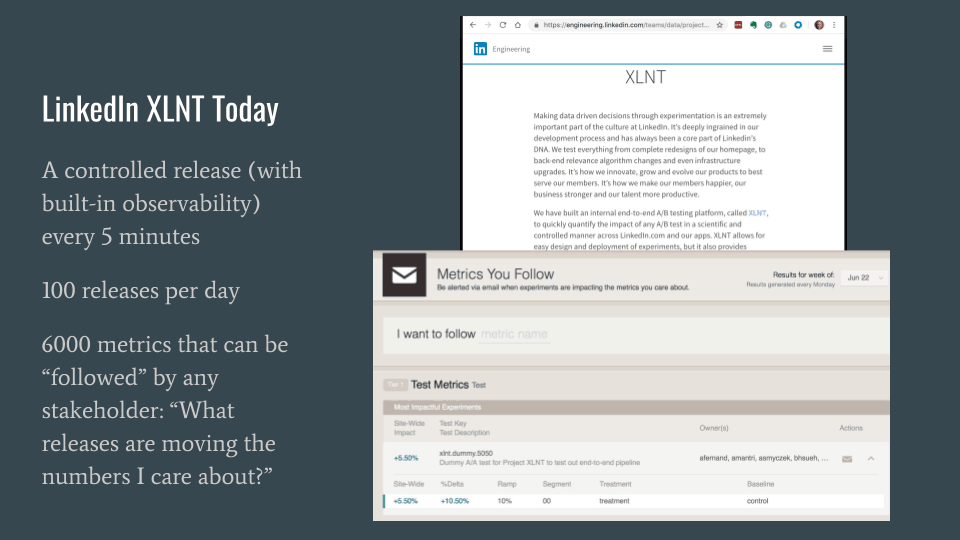
Then they built an analytics system that was a bit too flaky to achieve credibility. Stats would be way up one day and way down the next, so folks were reluctant to act on the results. Today LinkedIn has a trusted system that tracks thousands of metrics and launches a new rollout or experiment every five minutes or so.

Whether you call this more evolved way of doing things an “experimentation platform” or “feature flagging with built-in impact metrics,” once you see the value of automating the feedback loop this way, you’ll wonder how you ever survived without it. There is no going back.
We’ll talk more about choosing those metrics, calculating them from existing and new event data streams and balancing local optimizations with organizational guardrail metrics soon. For now, there’s a great blog post you can read by my colleague Sophie Harper, called How to Choose the Right Metrics for Your Experiments.
Jump to the next episode of Safe at Any Speed: Decoupling Deploy from Release: An Essential Foundation.
Get Split Certified
Split Arcade includes product explainer videos, clickable product tutorials, manipulatable code examples, and interactive challenges.
Switch It On With Split
The Split Feature Data Platform™ gives you the confidence to move fast without breaking things. Set up feature flags and safely deploy to production, controlling who sees which features and when. Connect every flag to contextual data, so you can know if your features are making things better or worse and act without hesitation. Effortlessly conduct feature experiments like A/B tests without slowing down. Whether you’re looking to increase your releases, to decrease your MTTR, or to ignite your dev team without burning them out–Split is both a feature management platform and partnership to revolutionize the way the work gets done. Switch on a free account today, schedule a demo, or contact us for further questions.
