The last few months have been some of the most (and somehow least) eventful of our lives, or at least, of mine. The rate of change in my experience of work has been intense, and working through that change has led me to some introspection on change within the technology industry.
I recently read that economic crisis can accelerate trends and transformations that were already happening. Given that, I was curious about what feature flag consumption could tell me about the performance of different industries and if it could shed some light on any current trends.
Analyzing Changes in Feature Flag Data
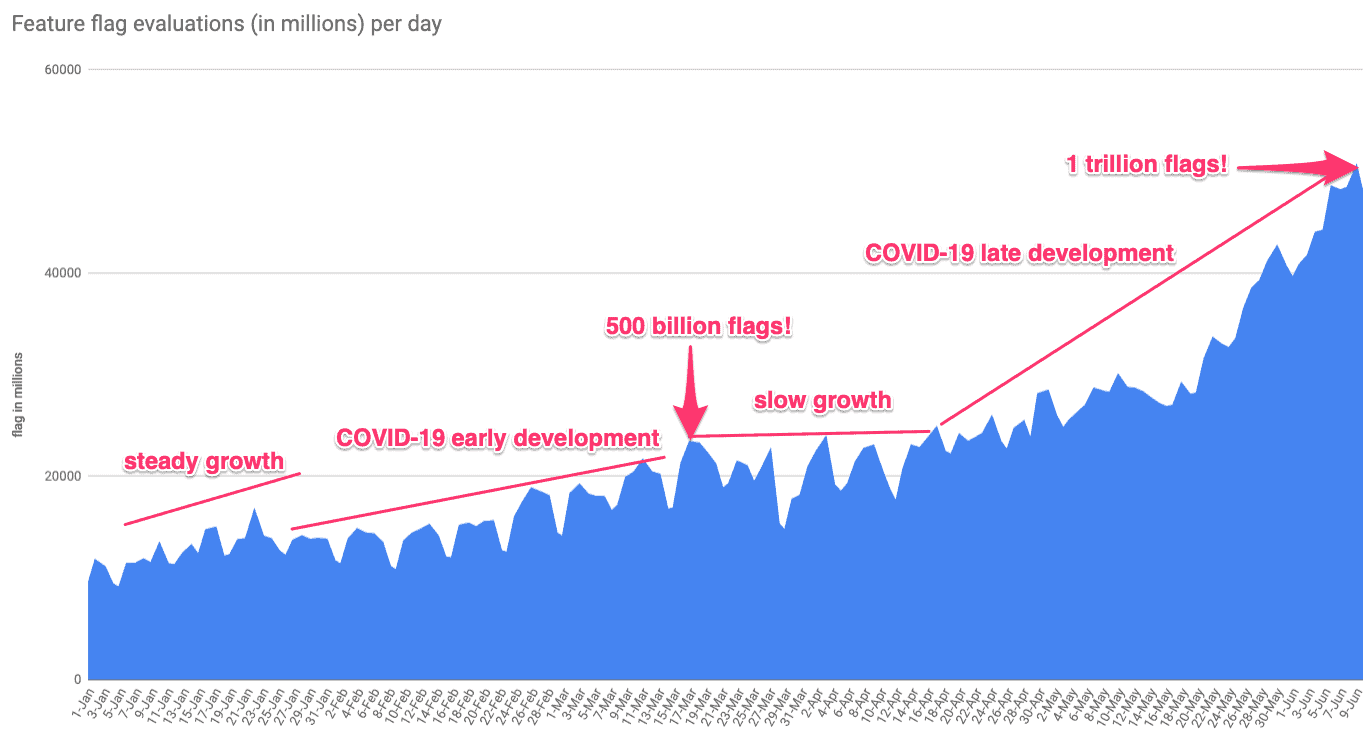
Back toward the end of 2019, Split was on a growth trend of about 20% month-over-month (MoM) feature flag consumption with a typical slow down around the holiday season (first red line). Subsequently, I noticed a reduction of growth on feature flag consumption(we track and measure every time our SDKs evaluate a feature flag) right when businesses began to revise their budgets due to COVID-19 news and adjust future sales targets. (See the valley in the graph below during February.)

The flat line indicates a period of no growth, which I attribute to businesses trying to figure out the path forward, reviewing vendor contracts, reducing expenses, and in some cases making the decision to lay people off. In late April/early May we noticed an acceleration of companies using feature flags and experimentation.
One Trillion Flags Served
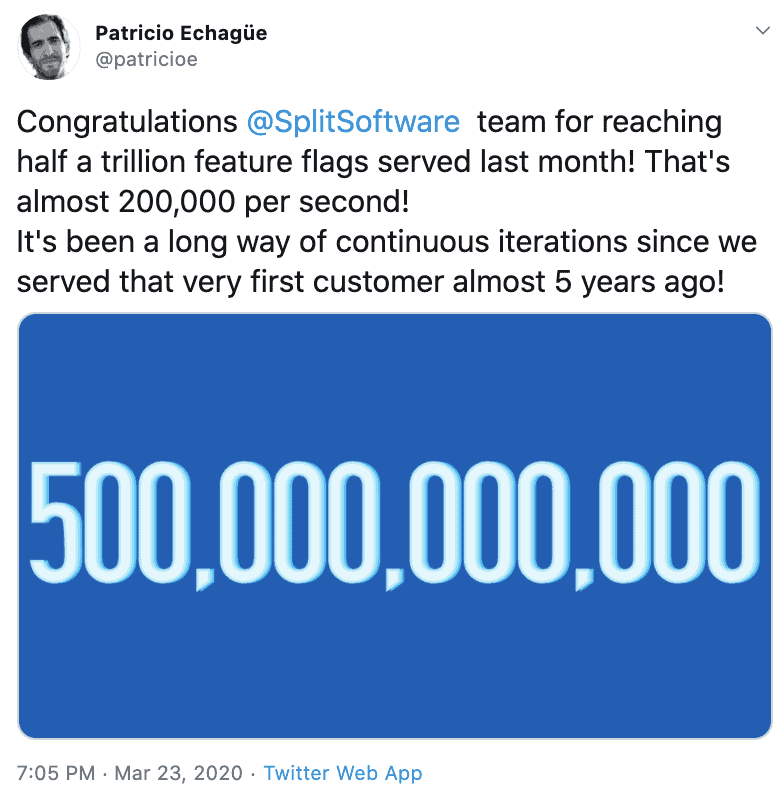
In the middle of that period, Split reached an all-time high of feature flag usage. We witnessed a peak at 500 billion flags served per month by mid-March.

From that point onward we noticed an acceleration in platform usage, once again, translated as feature flags served by our SDKs representing unprecedented growth. We reached the 1 trillion feature flags per month mark in early June.
I believe that the reason for this spike is due to the acceleration of digital transformation, with the caveat that folks are now trying to figure out how to bring value to their customers at a faster cadence, experiment more, learn and repeat. In this time of crisis, speed is king. The developer mantra of “move fast and break stuff” is evolving, as organizations deploy tools to move faster than ever while controlling user experience to prevent failure.
Industries Where Experimentation is Accelerating
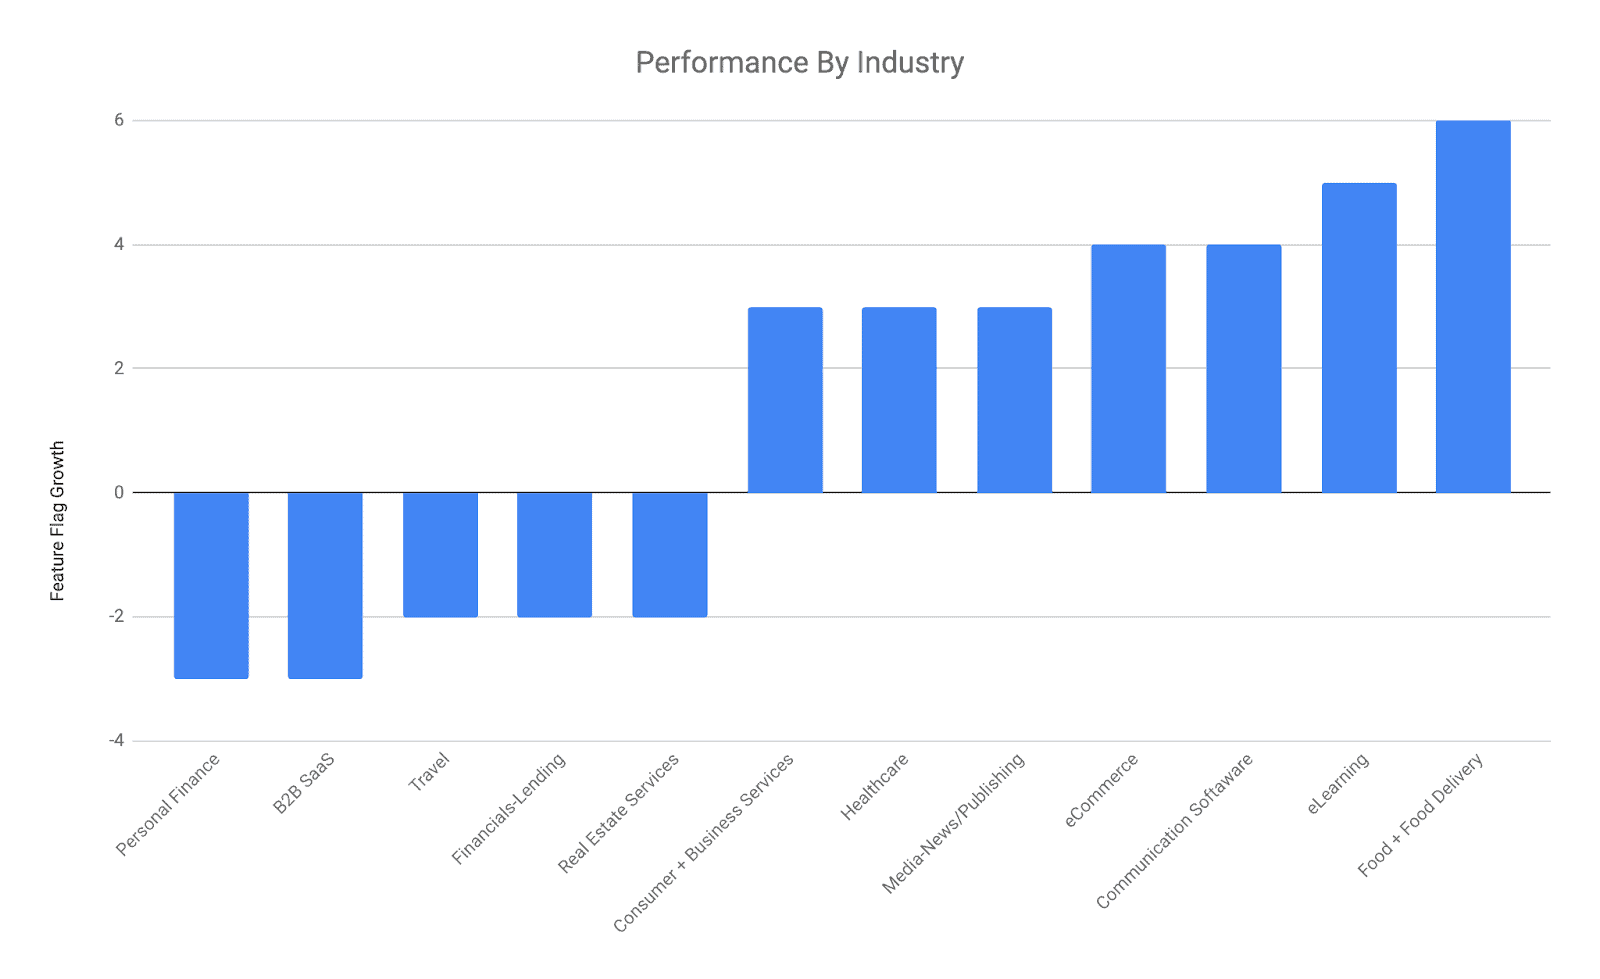
It will probably come at no surprise how certain categories rank against other ones given regional restrictions like shelter in place. The following chart shows the performance of the most noticeable categories relative to one another. The Y-axis has been removed for illustration and confidentiality reasons but know that the upper peak is at the 1 trillion flags mark.

The data has shown that the organizations with the highest feature flag consumption are in the following categories:
- Food and food delivery
- Business software-communications
- eCommerce and online marketplaces
- eLearning
Customer A, a drive-through fast-food business, saw their traffic increase by 30% compared to three months ago, and customer B, an on-demand delivery service, observed an increase in monthly active users of several million.
The eLearning category was significantly impacted by shelter in place orders, as more education institutions onboarded to these platforms to continue providing programming. In all of these examples, the organizations needed to react quickly to spiking changes, and likely couldn’t afford to follow their typical release procedures. They reacted by implementing additional feature flags to bring new functionality quicker to customers and to be able to run more experiments to drive more value.
Is Deceleration Real?
While huge traffic increases were expected as most of the world transitioned to an entirely new way of going about their day-to-day lives, during this period of time we also saw significant decreases in flag consumptions in a few industries:
- Travel
- Finance, specifically lending
- Real estate
Some of these come as no surprise given regional movement restrictions and sweeping layoffs. Travel, real estate, and lending appear to have been the most heavily affected.
This data reflects only a partial view since we see the world through the lens of feature flag consumption, and our sample size is limited to our customer base. I do believe this data is directionally accurate, and that many of the decelerations will revert as the current situation resolves.
As people have moved away from physical spaces, virtually every organization is experiencing an acceleration in their digital transformation — and understanding that transformation is more important than ever. We are fortunate to continue to play an important role in that transformation by helping businesses bring value to customers faster and more efficiently.
Ready to Experiment?
Split helps businesses deliver value to their customers faster. Feature flags allow engineering and product teams to separate push from release, increase their development cadence, and immediately mitigate risks via a kill switch. Full-stack experimentation functionality ensures you’re driving the highest KPIs for your organization. If this is valuable to you, we’d like to help. You can get started with Split today.
Get Split Certified
Split Arcade includes product explainer videos, clickable product tutorials, manipulatable code examples, and interactive challenges.
Switch It On With Split
The Split Feature Data Platform™ gives you the confidence to move fast without breaking things. Set up feature flags and safely deploy to production, controlling who sees which features and when. Connect every flag to contextual data, so you can know if your features are making things better or worse and act without hesitation. Effortlessly conduct feature experiments like A/B tests without slowing down. Whether you’re looking to increase your releases, to decrease your MTTR, or to ignite your dev team without burning them out–Split is both a feature management platform and partnership to revolutionize the way the work gets done. Switch on a free account today, schedule a demo, or contact us for further questions.
