Update: Data Export is Live (9/15) — You can now filter and download 90 days worth of data from Split in CSV format. Use Data Export to retrieve event data and run sanity checks to ensure your data integrations are working correctly. Bring feature flag data into a data warehouse or BI tool to analyze how new features impact product performance, user behavior, and business goals. Data export is located within the Data Hub and is available as part of our data export pack. Learn how to use Data Export in our documentation.
As development teams begin their feature flag journey, they quickly realize that managing the quality of their flags, and their associated data, is the key to success. An improperly configured flag doesn’t provide a speed or safety advantage. And improperly configured data feeds don’t support accurate impact analysis or A/B testing.
With the importance of data quality in mind, we knew we could ease these workflows for developers. So, we built Data Hub, which brings together our existing impressions view along with a bunch of new capabilities such as data export. Data Hub gives development teams a single place to view, query, and export all of their feature flag and event data.
A Single View for All Your Feature Data
Split collects two primary types of data about your features:
- Impression data — a record of each feature flag (we call them splits!)
- Event data — customer and performance info streamed from our SDKs and your own data pipelines
Data Hub brings these two data types together in one place. It supports several common workflows that development teams go through on a day-to-day and week-to-week basis:
- Validate splits are set up in the code correctly and debug if necessary
- Confirm Split is receiving the expected event data in the expected format, and debug if necessary
- Get the current state of the splits, segments, and attributes for a specific customer
- Analyze data in your data warehouse by exporting impressions and events
With these workflows now streamlined, you’ll be free to create splits and metrics faster and with fewer mistakes.
Live Tail: Validate and Debug Your Data on Command
Let’s start with the first two of these workflows. Validating that splits are correctly configured and that the right data is flowing into Split is of critical importance as you develop new features and track new metrics.
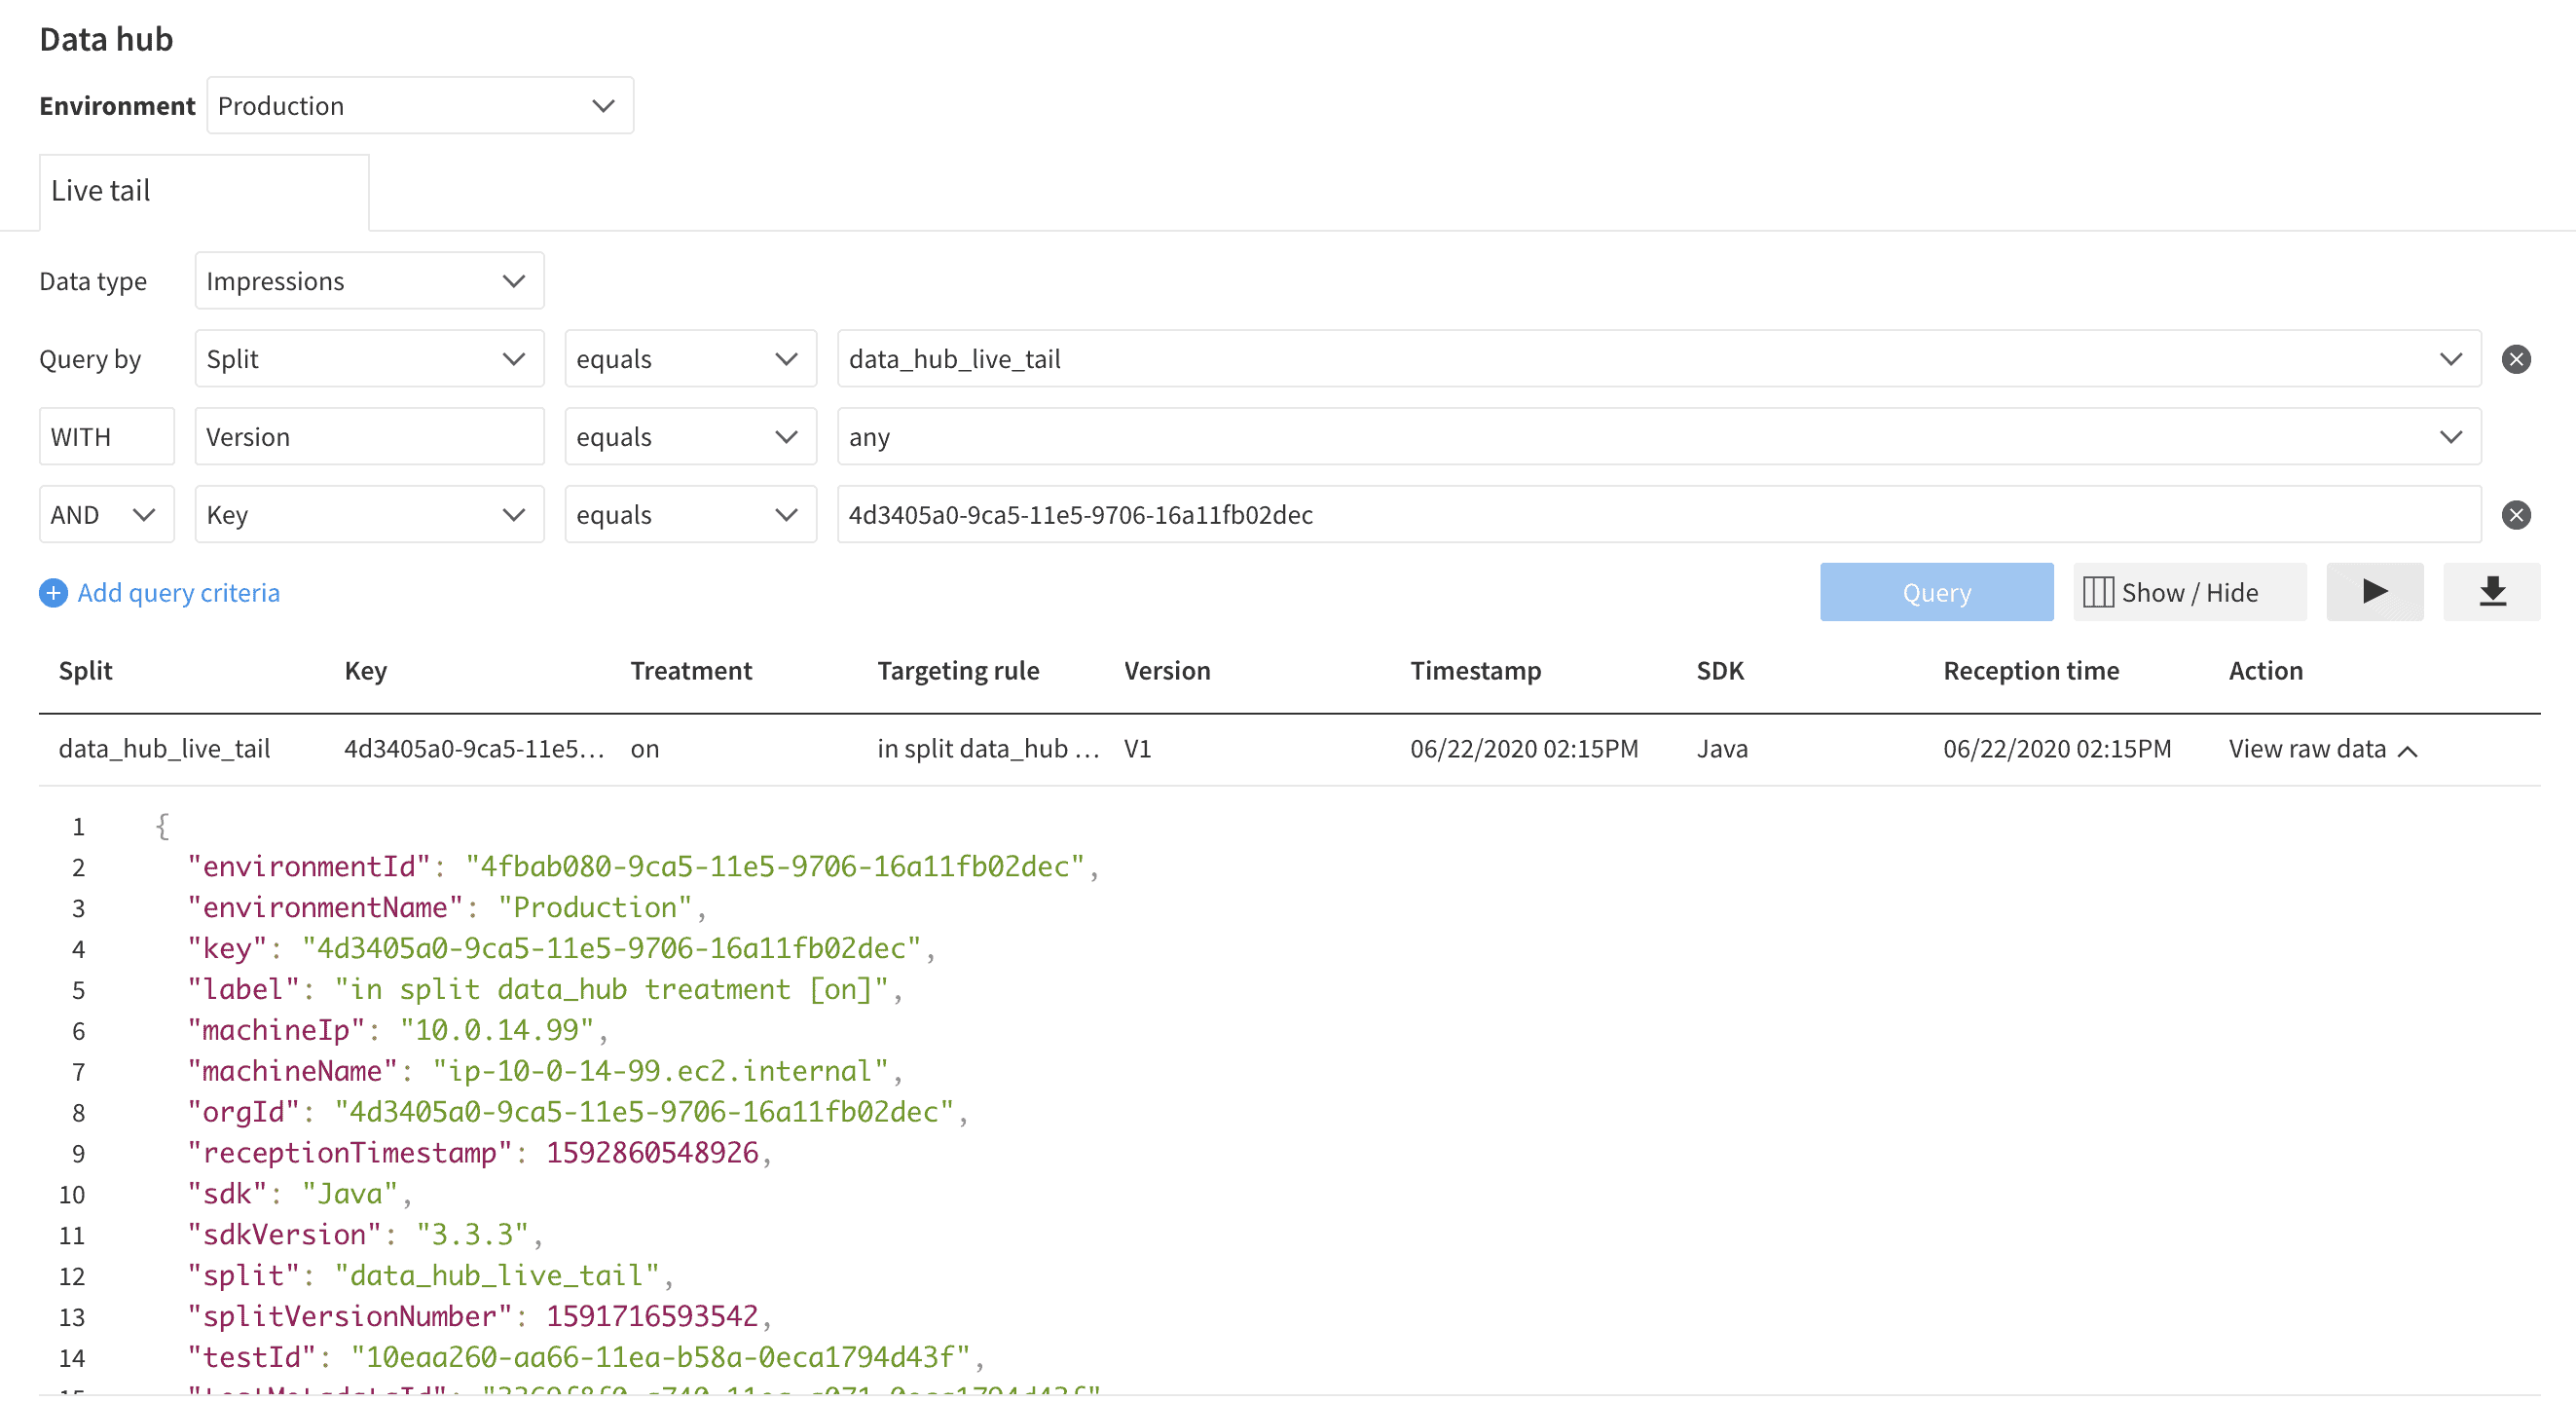
In Data Hub’s live tail view, you can quickly query feature flag data that is important to you via a range of filters. Filter by key to follow up on a customer support ticket. Filter by split to troubleshoot your code setup, or an issue affecting many customers. Or filter by integration or SDK to track down missing event data or a problem in a specific part of your stack.

There is also live tail functionality within the split page, as we know it is essential for users to quickly check their feature flag data within the context of a particular split, especially when adding or editing the targeting rules of a split. Here, you can also add additional filters to see more granular feature flag data.
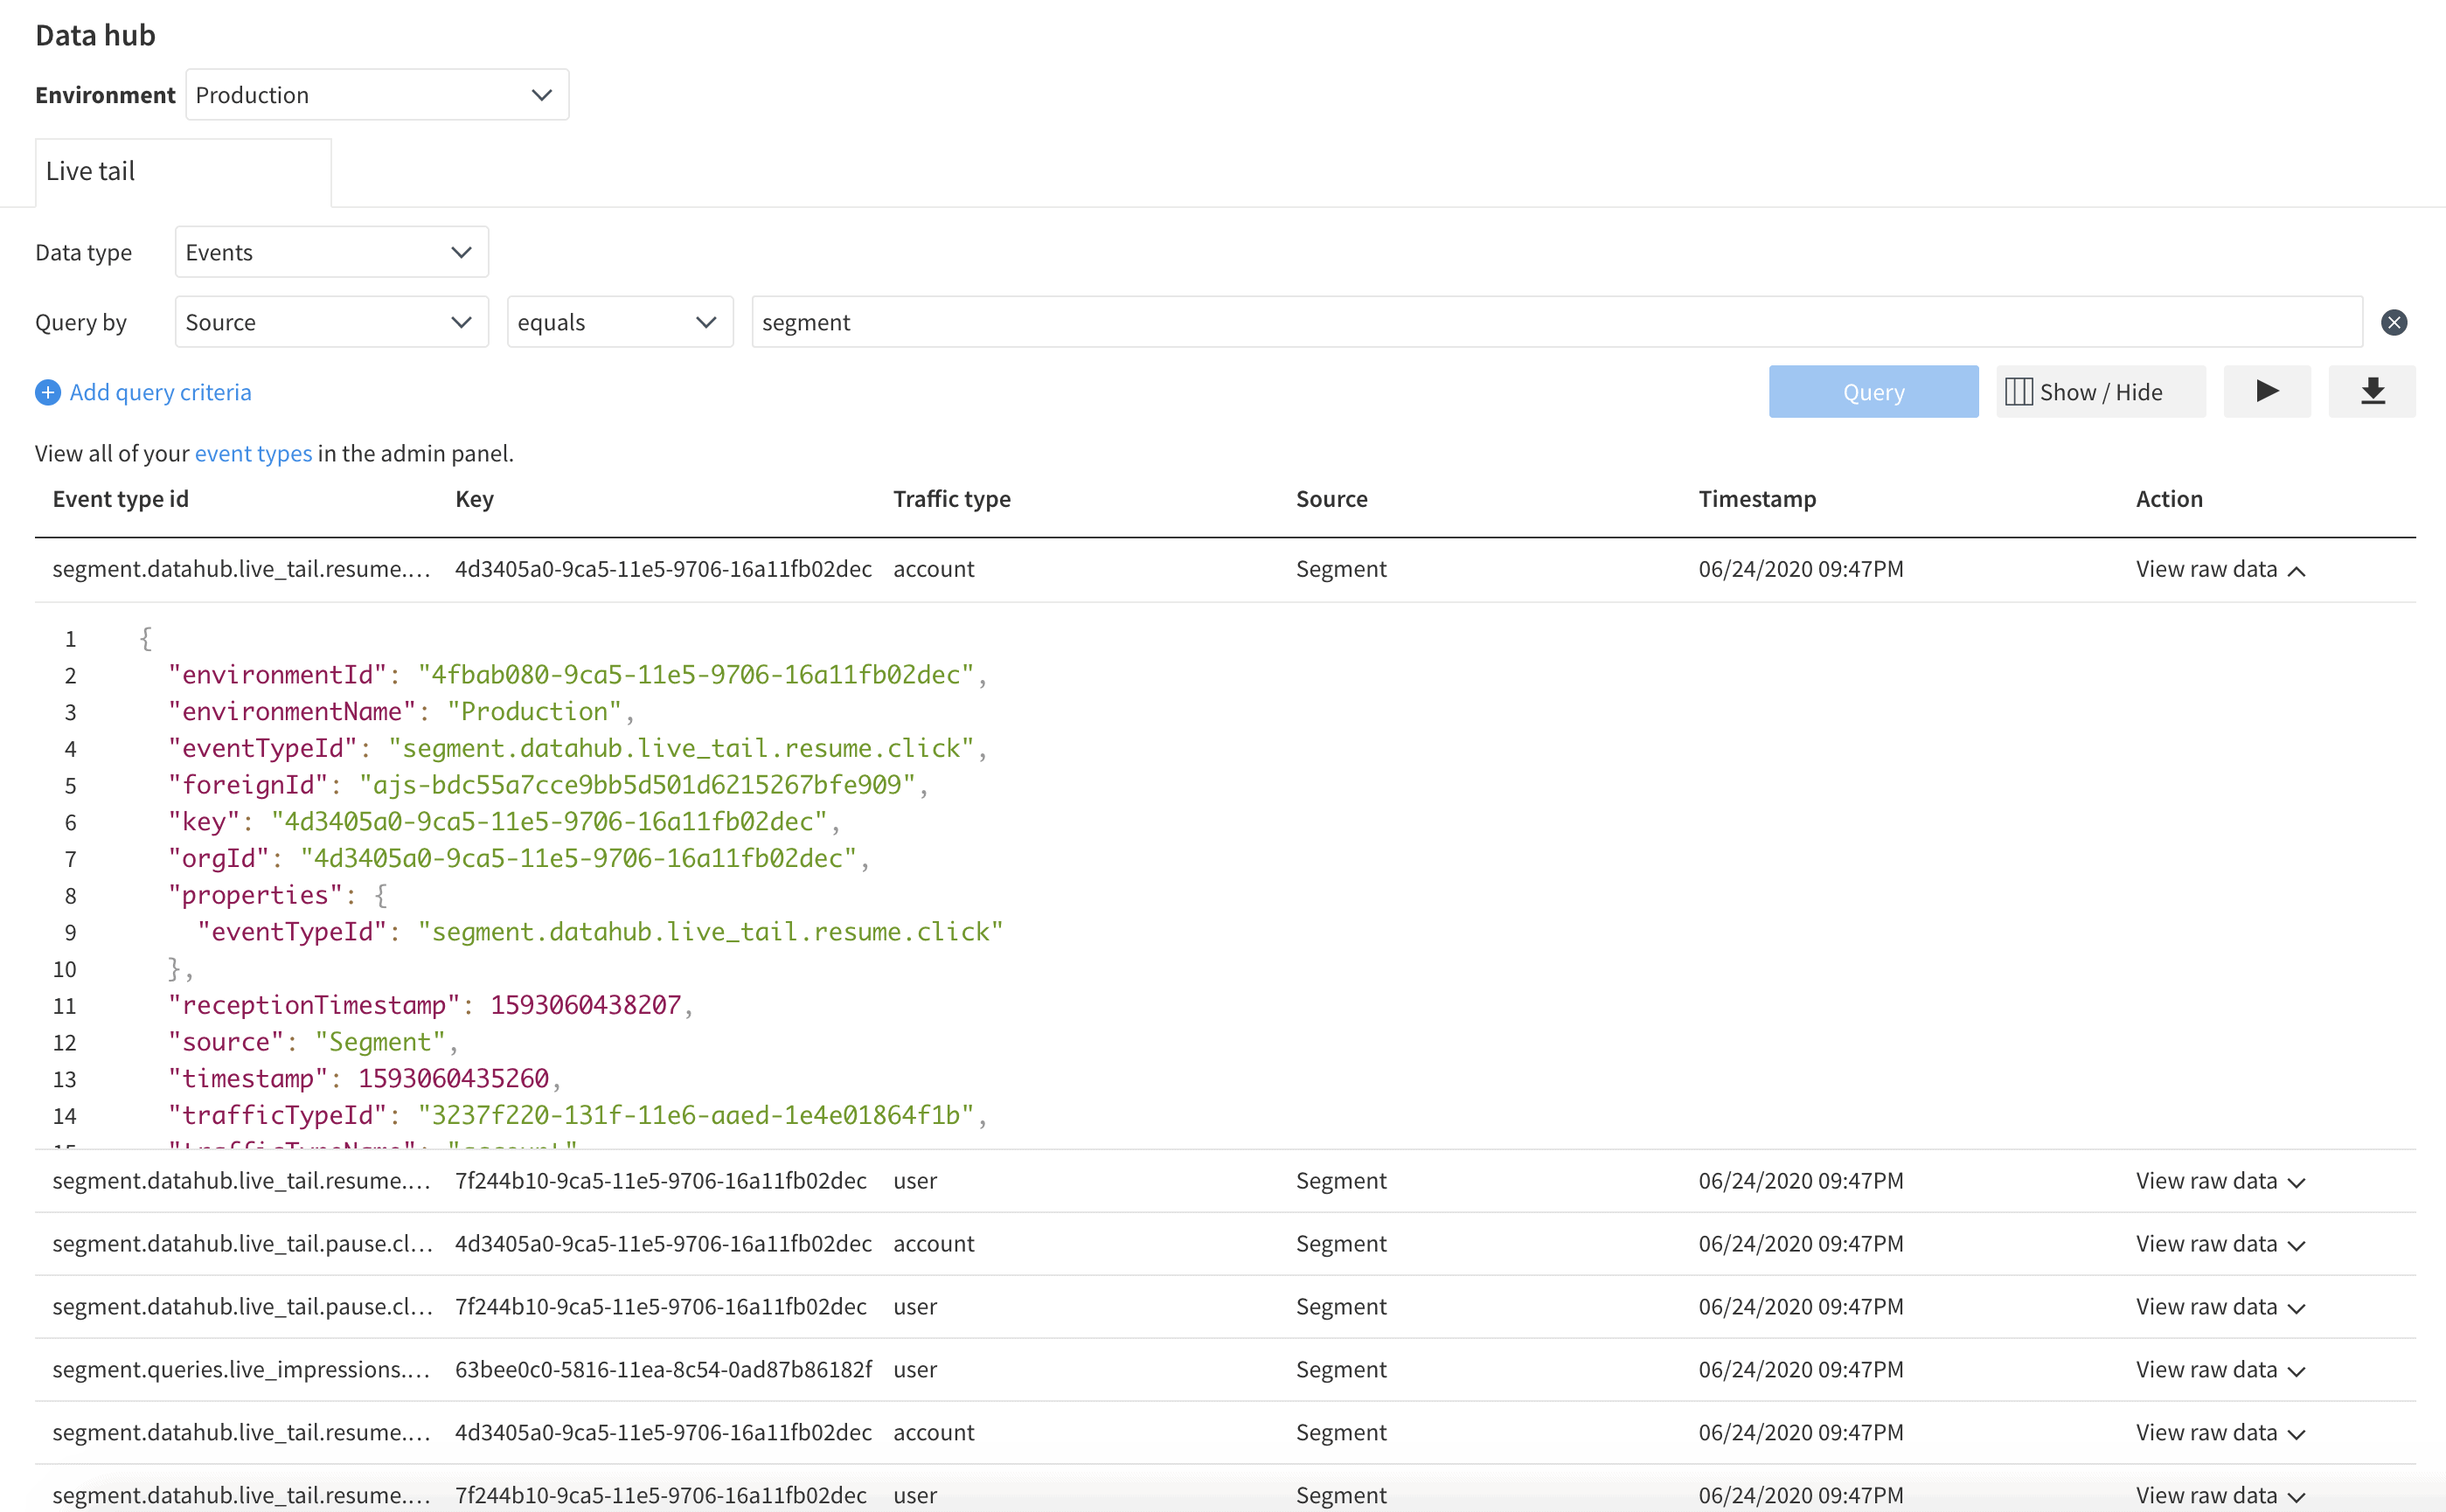
You can also use Data Hub to validate that your track calls and data integrations are set up correctly by quickly viewing all events for a particular event type, customer key, or source.

Customer Dashboard: Current State in One Place
Another critical workflow is the current state of the features to which a customer is exposed. Maybe you have a customer support ticket or need to confirm access to a beta program. As you embrace progressive delivery, knowing who has access to what becomes a bit more complicated. In these cases, you need to see the splits and segments for your customers.
Data Hub gives you a view of the current state of splits for any customer by filtering impression or event data by a particular customer key. Not only that, once you have a customer key in mind, you’ll have access to a new customer dashboard. In this dashboard, you’ll see all the treatments that key will receive for the splits within your workspace, all the segments to which that particular key belongs, and all the attribute data populated via Split’s API.

Data Export: Analyze Feature Data in Your System of Choice
Our last workflow is all about unlocking your feature flags for use in other systems. You can store impressions in your data warehouse, and mash up the data in the analytics tool of your choice, or just slice and dice it in your favorite spreadsheet.
Data Hub exports up to 90 days worth of data via CSV for analysis or debugging purposes. Similar to the live tail functionality, simply apply the appropriate filters and you can easily view the data that is important to you.
Live Tail and the enhanced customer dashboard are available today in your account. Data export will be rolling out gradually in the coming weeks if you have the data export pack.
For more info on Data Hub, check out our live tail and dashboard documentation. And if you’re getting started with feature flags, sign up for a free account and start using Data Hub today!
Get Split Certified
Split Arcade includes product explainer videos, clickable product tutorials, manipulatable code examples, and interactive challenges.
Switch It On With Split
The Split Feature Data Platform™ gives you the confidence to move fast without breaking things. Set up feature flags and safely deploy to production, controlling who sees which features and when. Connect every flag to contextual data, so you can know if your features are making things better or worse and act without hesitation. Effortlessly conduct feature experiments like A/B tests without slowing down. Whether you’re looking to increase your releases, to decrease your MTTR, or to ignite your dev team without burning them out–Split is both a feature management platform and partnership to revolutionize the way the work gets done. Switch on a free account today, schedule a demo, or contact us for further questions.
