Split manages more than 50 billion feature flags changes around the world every day. A recent study shows that about 5 to 6% of feature flags are rolled-back (or killed, using Split terminology in reference to a kill switch) within 30 days of being created. This speaks to the importance of making data available for short-term feature decisions, especially those that impact core KPIs.
The majority of our customers rely on external systems like APM services and integrations to other analytics systems to understand how a feature change impacts an area of their application they care about.
At Split we believe that feature flags are incomplete without data and so we worked hard over the last few months to create a real user monitoring (RUM) agent to provide insights into how a website’s key indicators are impacted immediately after a feature release. We paired this with our statistics engine to create alerts, even if only a subset of users experience a degradation from the baseline.
Website metrics captured
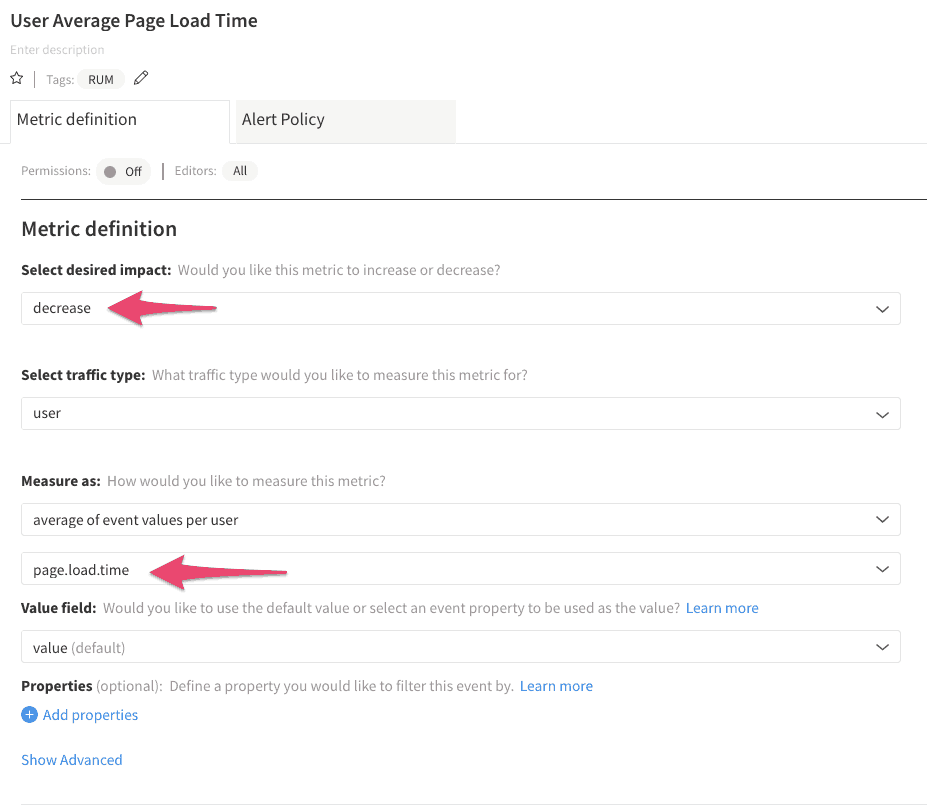
When Split RUM agent is installed on a website, our customers will be able to automatically receive five different metrics: page.load.time, time.to.first.byte, time.to.interactive, time.to.dom.interactive and errors.
All these metrics are available in our metrics section to allow customers to define custom metrics that better suit their application and on which to be alerted on when a feature is released.

Split will then compare the features each user is exposed to with each user’s metrics (like page.load.time) in order to determine which feature in your release is good, and which is rotten.
Similar to our recently released Sentry integration, by measuring these metrics in Split, our customers will now be able to get automatic feedback whenever a newly released feature causes a degradation for a subset of users for any of these metrics, and be alerted to take remedial action.

Roadmap
Our team is working hard to prioritize the next set of features for our RUM agent. Among them we have mobile support, new metrics like bounce rate, single page app (SPA) support and the ability to attach properties to the metrics from the RUM agent for allowing a more in depth analysis. As always, we’d love to hear your thoughts!
Getting started
Ready to test this out? Visit our documentation and give our RUM agent a try. Don’t yet have a Split account? No worries, sign up here to get started!
Get Split Certified
Split Arcade includes product explainer videos, clickable product tutorials, manipulatable code examples, and interactive challenges.
Switch It On With Split
The Split Feature Data Platform™ gives you the confidence to move fast without breaking things. Set up feature flags and safely deploy to production, controlling who sees which features and when. Connect every flag to contextual data, so you can know if your features are making things better or worse and act without hesitation. Effortlessly conduct feature experiments like A/B tests without slowing down. Whether you’re looking to increase your releases, to decrease your MTTR, or to ignite your dev team without burning them out–Split is both a feature management platform and partnership to revolutionize the way the work gets done. Switch on a free account today, schedule a demo, or contact us for further questions.
