Great teams don’t run experiments to prove they are right; they run them to answer questions. Since it’s human nature to want things to go your way, how can we guard against falling into the traps of wishful thinking and hidden biases as we strive to reach meaningful outcomes?
The answer is to follow a handful of core principles in the design, execution, and analysis of experiments proven by teams that run hundreds or even thousands of experiments every month. When you do, you increase the chances of learning something truly useful and you reduce the odds of wasting your time and heading off in an unproductive direction due to false signals.
Whether you are an “old hand” at online experimentation, merely “experimentation curious,” or somewhere in between, you’ll tilt the odds of productive outcomes in your favor by watching this lunchtime tech talk by Split Continuous Delivery Evangelist, Dave Karow, delivered before the Pinterest Experiments Guild on September 13, 2019.
Watch the Video of Dave’s Talk at Pinterest HQ
Notes:
- The Pinterest team generously shared the video of this internal talk, up to the start of Q&A (when some internal projects were discussed).
- Pinterest and Split are both active in the experimentation community, but Pinterest is not a Split customer.
Read the full Transcript and Screenshots
Aidan Crook: Thanks everyone for coming to this special edition of the experiments Guild. So I’m really excited to introduce today, Dave Karow, who works at Split.
About Split Software (split.io) and Dave Karow
Split is a startup company in Redwood City. They started working on mechanisms for companies to roll out features gradually using something called feature flags and they evolved into a company that’s really focused on experimentation as a big part now, and A/B testing, and they work with companies like Quantas, Twilio, Salesforce all to help them with their continuous delivery and A/B testing mechanisms.
Dave Karow’s role takes him to him to meet ups, to different clients, to meet with larger companies that have built out really scaled platforms. He’s got a great understanding and knowledge base from from all these different companies and people that he’s met within the industry. And so he’s here to share with us today some of these core principles about experimentation design analysis and execution that he’s learned from this. So with that everyone please give a big hand to Dave.
Dave Karow: [00:01:06] My official title is Continuous Delivery Evangelist. So it’s really people who want to move faster and be safe and learn. I put together this talk because I know there’s a wide range of people here: some of you would probably consider yourselves full time experimentation people and some of you would be people who use the experimentation platform from time to time and some of you would be people who are sort of just wonder what they’re talking about.
[00:01:30] My goal is to leave you with some key things to watch out for because experiment, you know, “With great power comes great responsibility.” That was actually another title for this for a similar presentation we gave in Europe recently.
[00:01:45] Let’s let’s jump right in. So here’s what we’re gonna do. We’ll very quickly cover why would we experiment, and then why sweat the details, and then we’ll do the core of the talk which is really the principles and then some wrap up in Q and A.
Why do online controlled experiments?
[00:01:59] So, why experiment? How effective are we moving the needle?
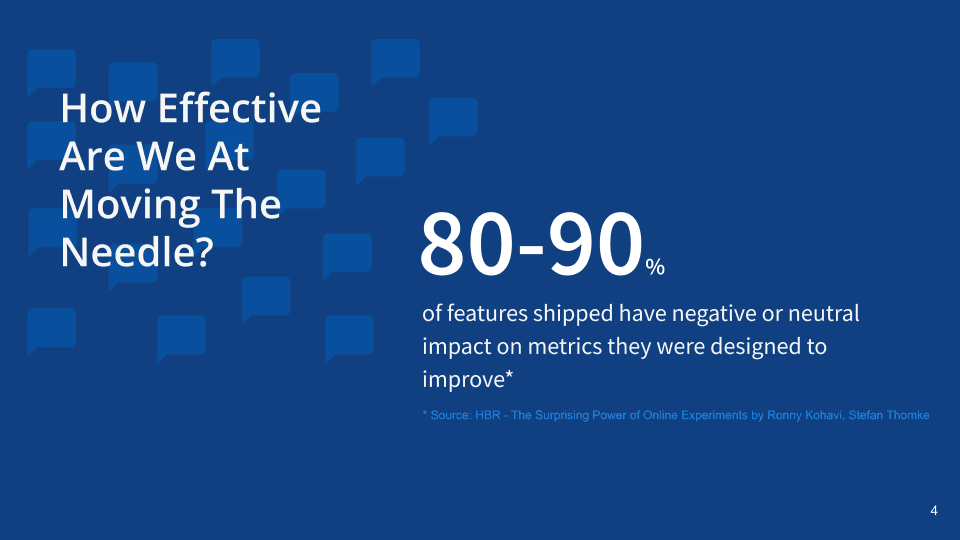
[00:02:03] There are stats out there. This is one of those scary ones which is which was Ronny Kohavi… Some of you met Ronny here. In a paper he did he quoted 80 to 90 percent of the stuff they do doesn’t actually accomplish what it supposed to do. So we built this feature because we wanted accomplish X and 80 to 90 percent of the time it doesn’t move that needle or makes things worse. And in a world where you’re not doing experimentation, you might not notice. You think, “Well, we got that done, and we got that done.” You sort of check off the boxes and feel like you’re making progress. So being able to see whether you’re making progress or not is good.
Then HiPPO Syndrome
[00:02:38] There’s another fun one so who here has heard the term hippo?
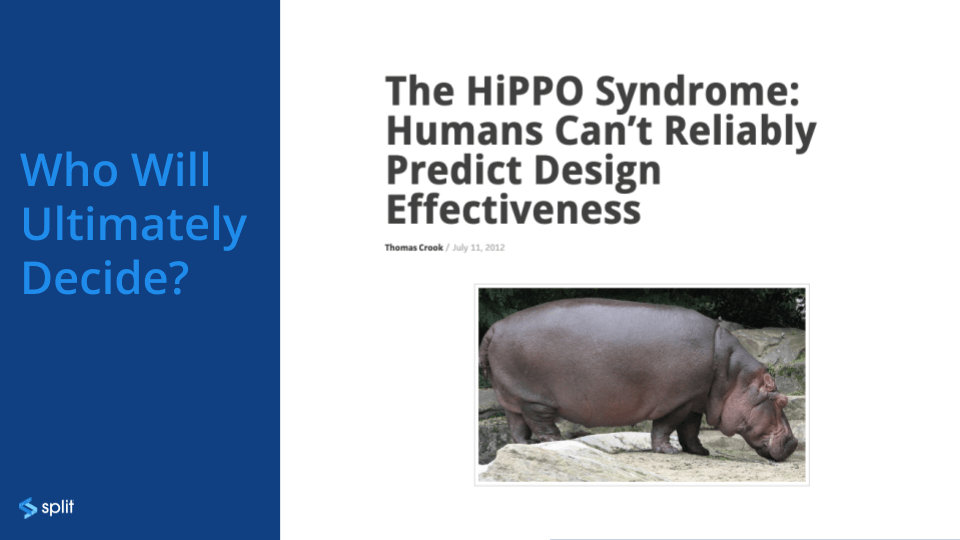
Dave Karow [00:02:42] Highest paid person’s opinion. Right. So there’s a great article from Thomas Crook. A great article, “The HIPPO Syndrome.” And you know who ultimately decides whether a feature is successful?
[00:02:58] I want to quickly guess who really decides whether a feature is successful. It’s kind of a paradigm shift question. Actually, it’s the users, right? So there’s a quote here,.
A/B testing doesn’t replace good design
[00:03:13] “Some designers and managers have attacked A/B testing because a misconception that testing somehow replaces or diminishes design. Nothing could be further than truth! Good design comes first.”

[00:03:21] And I was at meetup last night where somebody said, “Yeah you’re a product manager and you said you ran this experiment but didn’t you involve design?” It was kind of funny because of course she did. She has a team that has designers and coders and testing people and they put a lot of effort into setting up their experiment with a new design. This isn’t about not doing design. This is about actually figuring out whether your guess about what’s going to work is actually going to make a difference. And I thought this was great.
End users are the final arbiters of design success
[00:03:49] The key is that the end users are the final arbiters of the design success right? Whether they use it whether they do what you wanted them to do was actually what matters, not whether you think you did a good job, right?
[00:03:59] “And A/B testing is the instrument that informs of their judgments.”.
[00:04:01] This is why we do experimentation is to actually figure out are we moving the needle or we actually does the thing we think we should spend time evolving is it actually going to help or not.
Why sweat the details in online controlled experiments?
So then comes this, Why Sweat the Details. So if some of your metrics look better doesn’t that mean you’ve done, everything looks great right?
[00:04:21] The problem is that it’s pretty easy to be fooled, which is why I came up with the title of the presentation about how to avoid lying to yourself. When I say we want to avoid the cost of false signals this it could be opportunity cost. It could be literally money you spend on whatever you doing it just waste of time and energy. Right. You want to spend time. So we want to avoid the cost faults the cost of false signals.
Type I Errors and Type II Errors
[00:04:42] So just a quick terminology thing many of you may know type 1 errors and type 2 errors, a statistical thing. So a false positive. I like this because it helps you understand what these are (I always get them confused, to be honest with you). I’ll swap false positive and false negative. But this really helps you, if you just remember this If a doctor says to a guy, “You’re pregnant,” that is clearly a case of a false positive. He’s not pregnant, and the doctor says he is. In this case the doctor, to a very pregnant woman says, “You’re not pregnant.”.
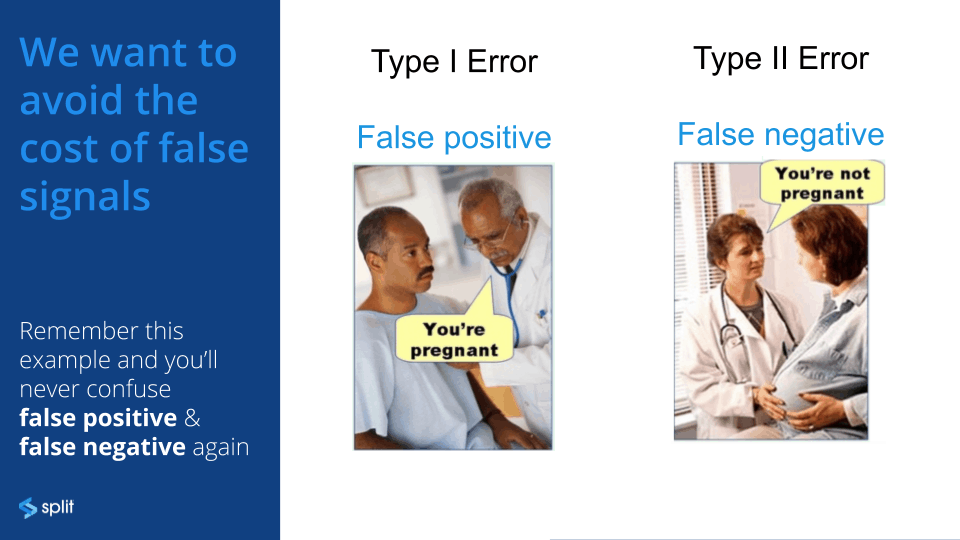
[00:05:11] We don’t want that to happen. We don’t actually want to think we move the needle and have not moved the needle, and we don’t want to move the needle and not realize we did. That’s one of the reasons I sweat the details.
We want to avoid the cost of human bias
[00:05:23] The other one is this which is a little scarier which is we want to avoid the cost of human bias. This is pretty insipid and pretty nasty and it’ll kind of come back again and again which is if you go looking for what you’re hoping to find you quite possibly find it. Which doesn’t mean that it’s there as much as it’s not there, it’s just that you were looking for it so you found it.
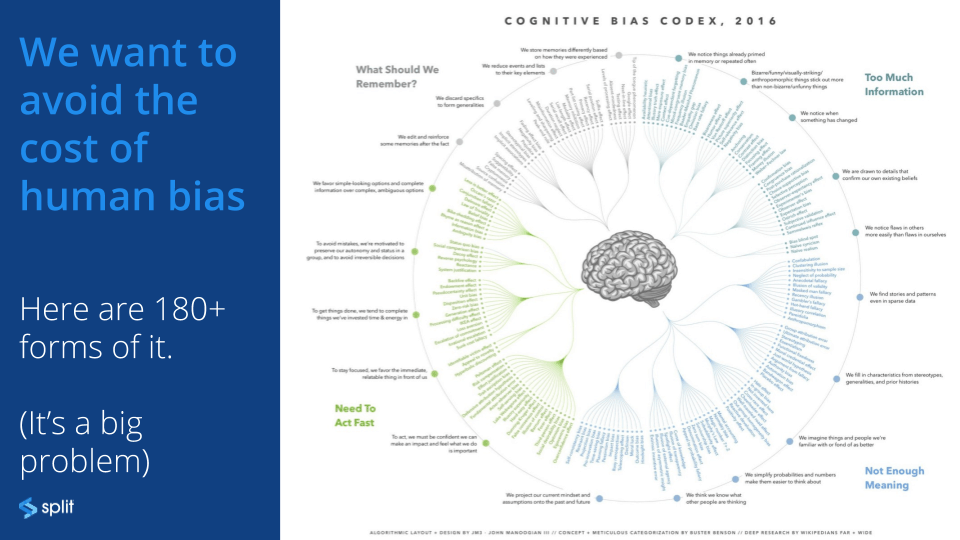
[00:05:47] Here’s a chart with one hundred eighty forms of human bias. The really obvious ones you’ll hear would be like observer bias or survivor bias which is a different thing which is that if you only sample people who made it through your funnel to a certain state then you’re looking at the wrong population. If your goal is to affect how new visitors behave. Observer bias, the idea that you you go tease the data to find the thing you were hoping was gonna happen. That’s not the same thing as having a disciplined way to approach it.
Eliminating external influences (including your own biases)
[00:06:17] The good news is that controlled experimentation done well removes external influences, whether those external influences are sort of seasonality, or other stuff that’s going on, or advertising or whatever. Or be it your own influence. By external, they mean external to the user interaction, not to your brain.
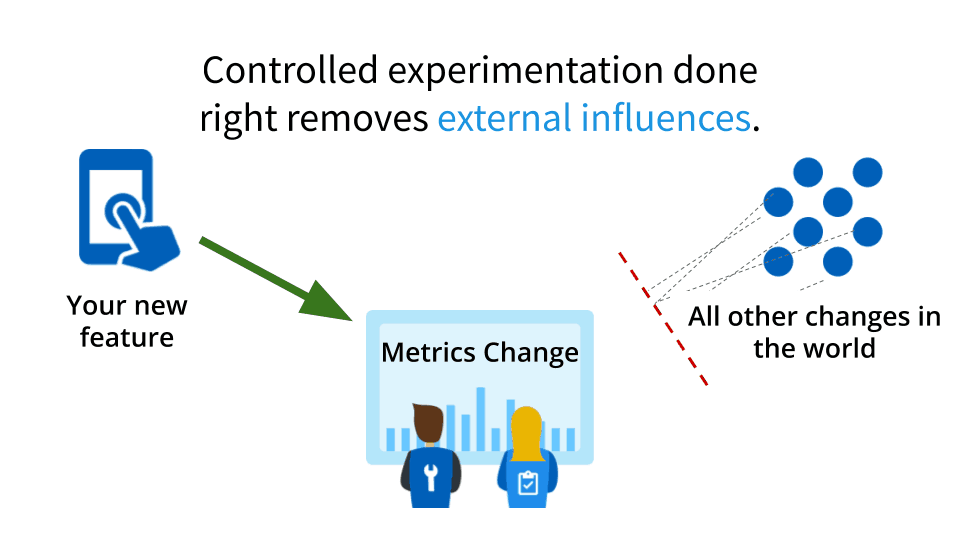
[00:06:37] That’s the good news: there are ways to overcome this. So the fact that there’s random noise and stuff is actually… You know life’s like that. Life is bumpy. Life’s not like perfect on off states. So there’s always gonna be some randomness. If you thought that flipping a coin A THOUSAND TIMES WOULD GIVE YOU EXACTLY FIVE HUNDRED heads will most of us probably wouldn’t think that you think well it’s going to be close’ish. Right? If it doesn’t come up exactly five hundred that doesn’t mean it’s biased.
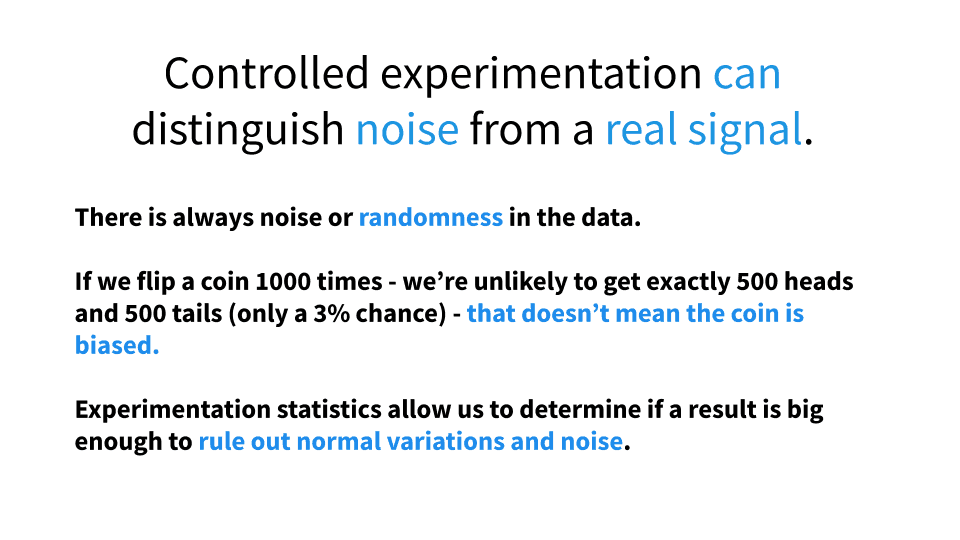
[00:07:06] Stats is basically trying to make science of how do we figure out when it’s meaningful and it’s not. How do we figure out if the results are big enough to rule out variations in noise. Okay. So the stuff I just cover here is pretty much just background. Most of you probably know most of what I just told you. I just wanna make sure that we’re kind of starting from the same place.
[00:07:30] So let’s get to the meat of it.
Core experimentation principles by experiment phase
[00:07:33] I’m going to use an example throughout here. Aidan gave me some awesome advice, which was don’t use a Pinterest example, because you guys probably know more about Pinterest than I do. I love the little bits of wisdom Aidan throws out there. That was one of those sort of blinding flash of the obvious I was like. Good point.
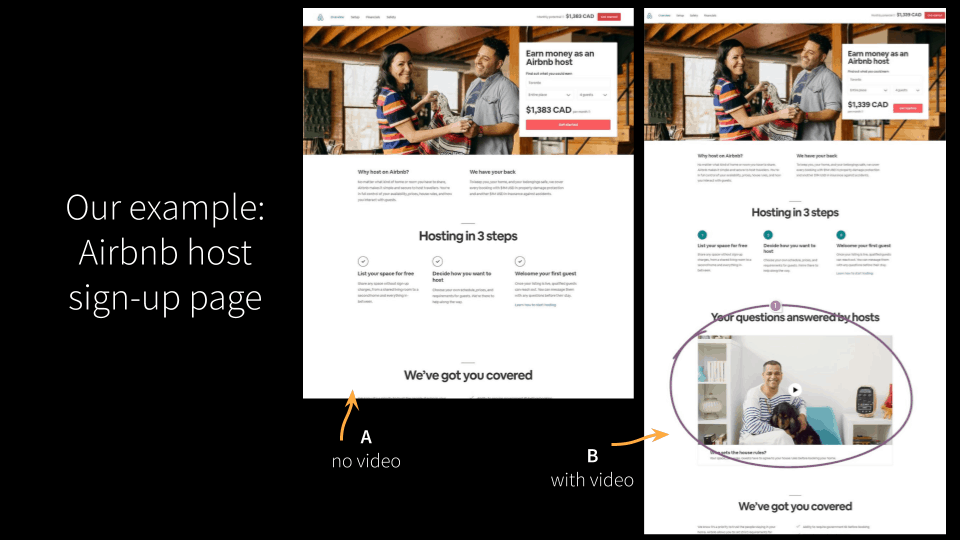
[00:07:52] So this is an AirBnB example. And in this case what they want to figure out is is if they have they’re trying to sign up new hosts. They’re not trying to sell people on staying somewhere they’re trying to sell people on being a host.
[00:08:07] They’ve got two variants: one is currently there’s no video, and they think if they add a video from hosts people will say well now that I’ve met these people and I understand the benefits they get of doing this I’m going to feel more inclined to be a host.
Principles to follow during the experiment design phase
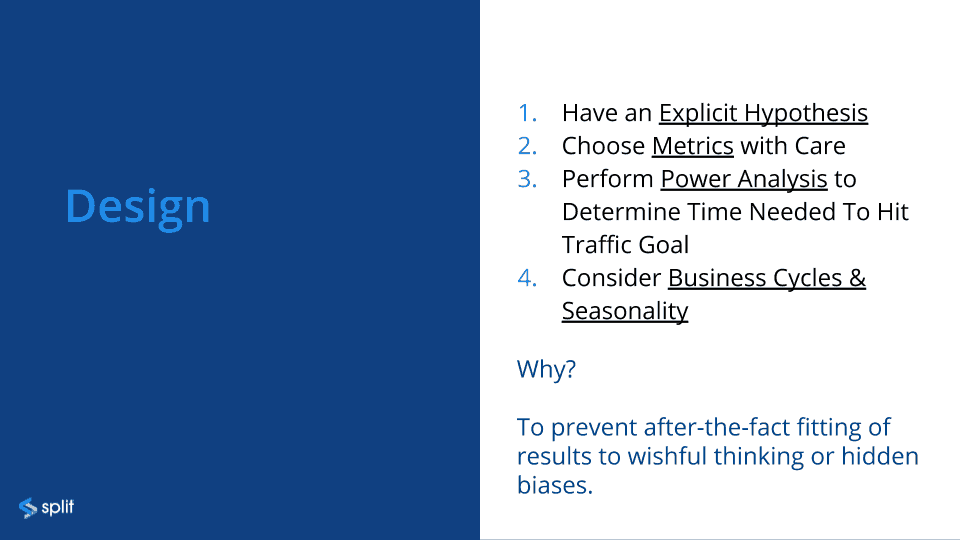
[00:08:22] We’re going to step through the design execution and analysis and most of it’s going to be in the design part and that’s that’s kind of one of the big takeaways we’ll have. So have an explicit hypothesis choose metrics with care. I’m going to go into these in detail by the preview perform power analysis determined the time you need to hit the traffic go and consider business cycles seasonality. There’s going to be I believe 10 core principles in here. So here’s the first four and let’s jump in and see what we’re talking about here.
Resist the urge to fit data to your expectations
[00:08:51] By the way, why are we doing this? Well, because we want to prevent after the fact fitting of the data. If you just run an experiment, which is you try something, and then after it’s over you start looking to see what you learned. Again the problem is that the likelihood of human bias kicking in is super high.
[00:09:08] So first one explicit hypothesis and I’m highlighting word explicit because people say well we think, “mmm.. blah blah blah blah.” Depending on how you approach this and how disciplined you are, and where you work. I’ve talked to shops where they have to be super crazy, they have a very detailed document to fill out and I been places where people have like one line in a form somewhere like, “What are you trying figure out?”
Standardized format for stating your experiment hypothesis
[00:09:31] So. There’s a guy named Craig Sullivan probably at SkyScanner, because this is where the next little bit is going to come here from, came up with a simple way to do hypothesis and then a more advanced one. It’s simply like because we already have seen something because we’ve seen something in our business we expect that if we change something will cause some impact some desired impact and we’ll measure this using some metric. That’s the basic one.
[00:09:59] This one’s a little more useful which is because we saw a mixture of qualitative and quantitative data. We expect that if we change blank for population blank it’ll cause these impacts and we’re going to notice this when we see data metrics change over a period of this much time.
[00:10:17] Now this one is way more useful. This one is still actually way too fuzzy because if you don’t set the time if you don’t if you don’t actually know exactly what you’re going after you again you’re more likely to cherry pick the results.
Applying the “simple kit” to form a hypothesis
[00:10:30] So if we put that in here we’ll do like a simple version hypothesis then a better one. So because we see potential hosts aren’t aware of their level of control when they’re running their own property we expect that adding an informative video will provide reassurances leading up to more sign ups. People will be less stressed about it and we will measure that using this metric: The proportion of users who sign up as host.
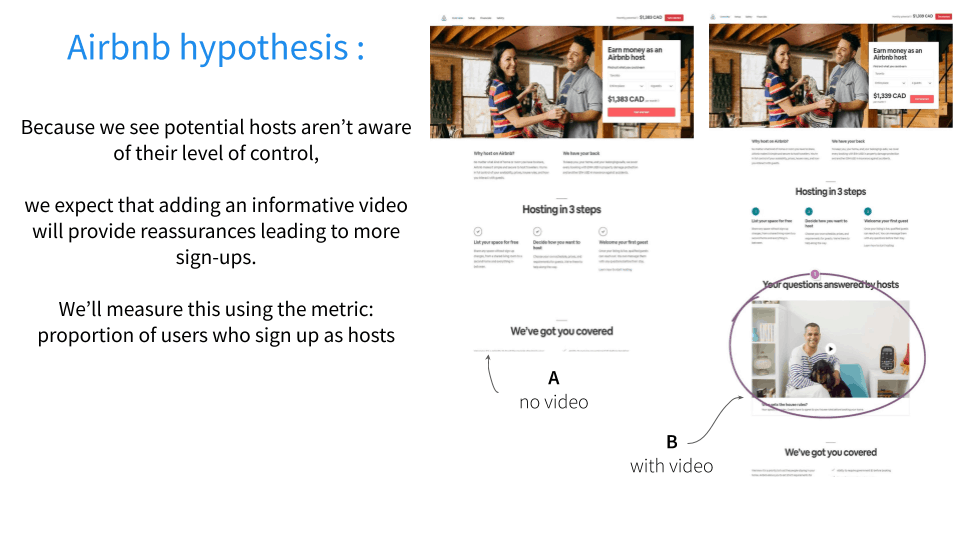
[00:10:50] What’s the problem? How many people use Airbnb and what do they use it for? Who here has ever used Airbnb. OK. How many of you host a property on Airbnb? Yeah right. So that’s a pretty flawed metric.
Applying the “advanced kit” to form a better hypothesis
So the better version is like this, “Because we actually did a survey which show that potential hosts aren’t aware of their level of control, we expect that adding an informative video just for Canadian users because that’s the one they’re going to focus on for now, we’ll provide reassurances. We will measure this using a metric, proportion of users who visited the host home page who sign up as hosts.”.
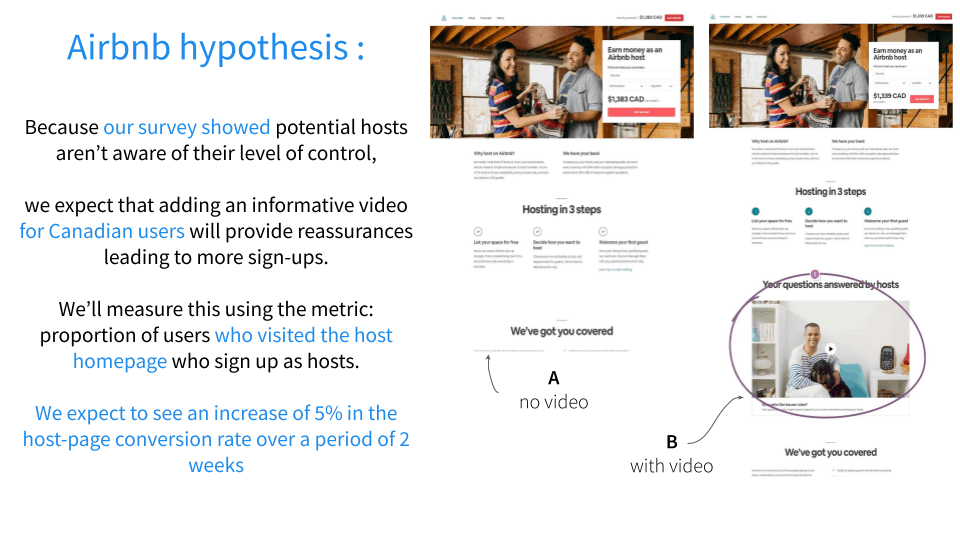
[00:11:24] Much better funnel right? So people who go look at the idea of being a host. We want to see what proportion of those sign up with this on and off. And we expect to see an increase of 5 percent on the host page conversion rate over a period of two weeks. Right. So just a better example of hypothesis.
Choosing metrics for your experiment with care
[00:11:38] Here’s where the meat of the talk is and I’m actually going to go into subsections of this one. This is the stuff that hopefully, even if you consider yourself like really into this experimentation, you are going to see at least one thing in here where you feel you probably ought to pay a little more attention to that.
[00:11:55] Good metrics.
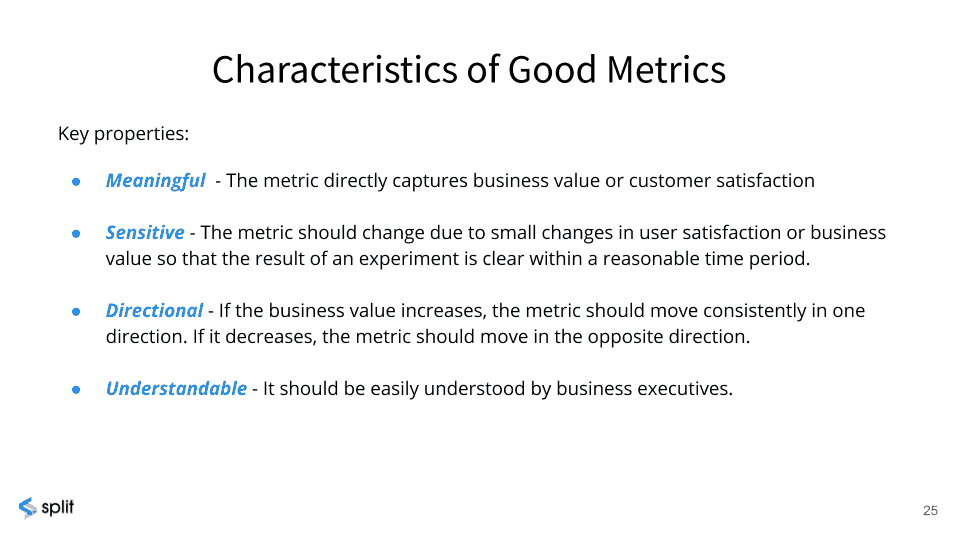
I was going to turn this into an acronym like MUDS or something but, they’re really in an order for a reason, which is that they need to be meaningful. The metric needs to actually capture business value. It can’t just be a random thing, like page views in a vacuum. So some actual data capture of business value or something about customer sat. And then it should be sensitive, which is if you’re running an experiment over a two week period of time, you can’t go with lifetime customer value as one of our metrics. How are you going to measure lifetime customer value in a two week window. You can’t. You have to find a proxy for something desirable, that’s sensitive enough to move.
[00:12:33] And it has to be directional. It can’t be going all over the place and have nothing to do with the outcome. If business value is higher the metric should move up. Or down. But it should be consistent it shouldn’t be like what to go one way or another and it doesn’t really mean anything.
[00:12:48] Then the last one is kind of actually crazy important which is it should be understandable by business executives. So it’s hard to make hard to make a case about what you’ve just accomplished, if the people you’re explaining it to think it’s some random or hypothetical thing that they can’t relate to.
[00:13:06] Now we get into the more fun examples. Beware of focusing on the wrong metric!
[00:13:11] You did meet Ronny Kohavi. I don’t believe he brought up this example when he was here. They had a goal, which was, “Hey! We want to maximize the number of queries run per user.” This isn’t what happened right away, but over time the whole team was trying to figure, “How do we get more queries? How do we get more queries? How do you get more queries?” Right?
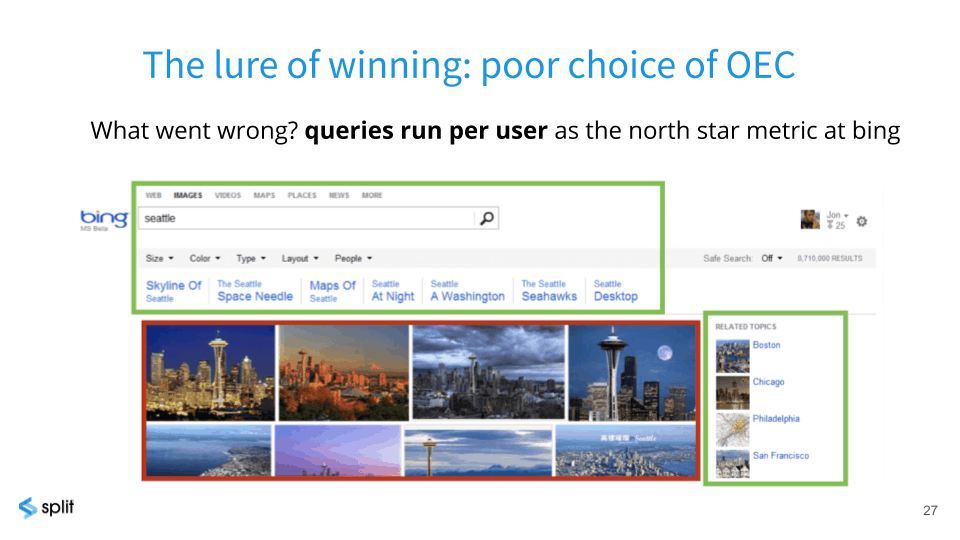
[00:13:28] What they did is they added these easy query refining links down here and they added these easy related query links here and they started filling up the page with ways you could get another query run quickly. You ever seen this kind of stuff on Google? No!. What they realized was that they were getting more queries, but they were cluttering up the interface. They were basically gaming it. They were trying to find ways to get more queries, but users don’t come there to do lots of searches, they come there to get something and leave.
[00:13:57] So, they had to totally change their Northstar metric away from “queries per user” into “returning visitors” because they want people to come back to BING because it was so useful, not they want people to have 10 queries in one session, because they’re poking around. Right?
[00:14:15] So it gets a little weirder.
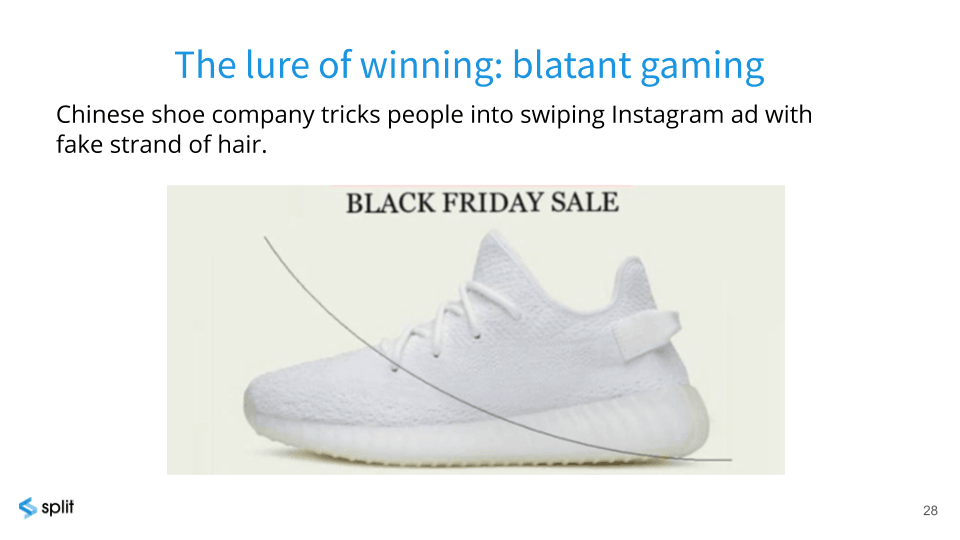
[00:14:17] Has anyone heard this one before? What’s on my screen what’s what’s blocking the shoe there? If you’re looking at your phone and you saw something like that what might you think you’re looking at, especially if you are black hair? This team basically put the image of a hair over the shoe, so people would think, “I’ve got to move the hair out of the way!”.
[00:14:39] So, lo and behold, they were able to achieve more swipes, but they weren’t measuring whether people were buying the shoes, just whether they got a swipe. They could say, you know, “We’re heroes!” Where you would actually be thinking, “Oh! That was deceitful and annoying. I don’t like that company!” So that’s following the lure of winning, and this is a blatant case of gaming it.
[00:15:02] We’ll get to another when we talk about metrics in a little bit.
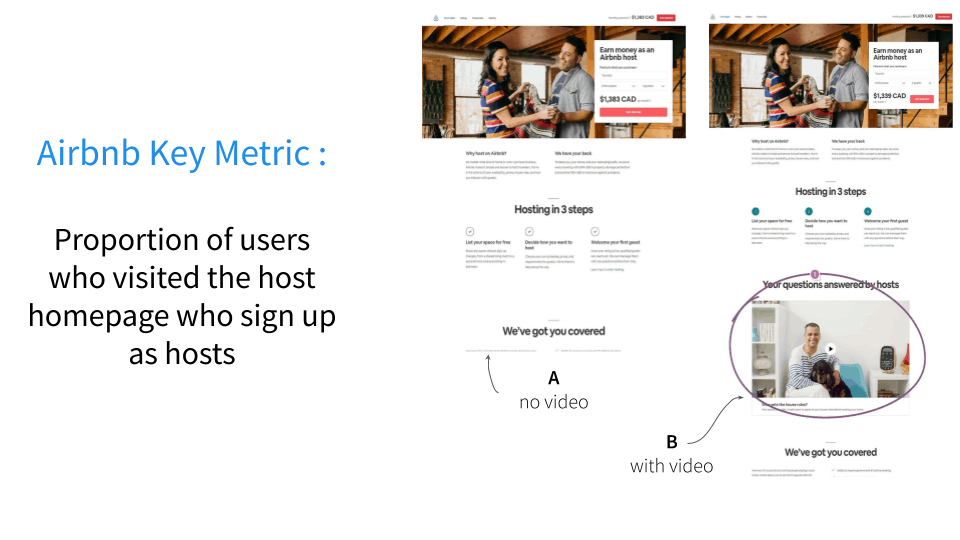
[00:15:09] In this case of Airbnb, the key metric was proportion of users who visited the home page to sign up as hosts. Straightforward anybody could understand that. It’s a proxy for a lot of things: your goal is to convert people to sign up. Now, maybe you also want to track whether those people actually ever rented their property the first time or something, but that’s hard to measure in a short period of time. So that was what they settled with.
[00:15:32] Here’s we’re going into some other kind of crazy examples beware of measuring just one metric. Has anyone heard about the this example?
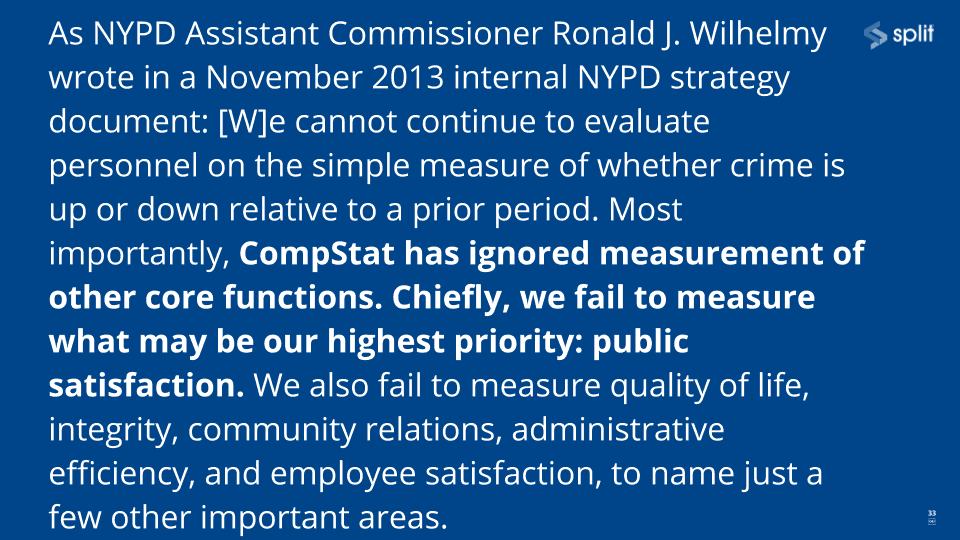
The New York Police Department said, “We are gonna have a system that’s going to keep statistics. That’s going to help us do a better job of policing.” The problem was that their one metric was reduce reported crime. So is the police job to reduce the number of reports for crime or maybe to reduce crime rate?
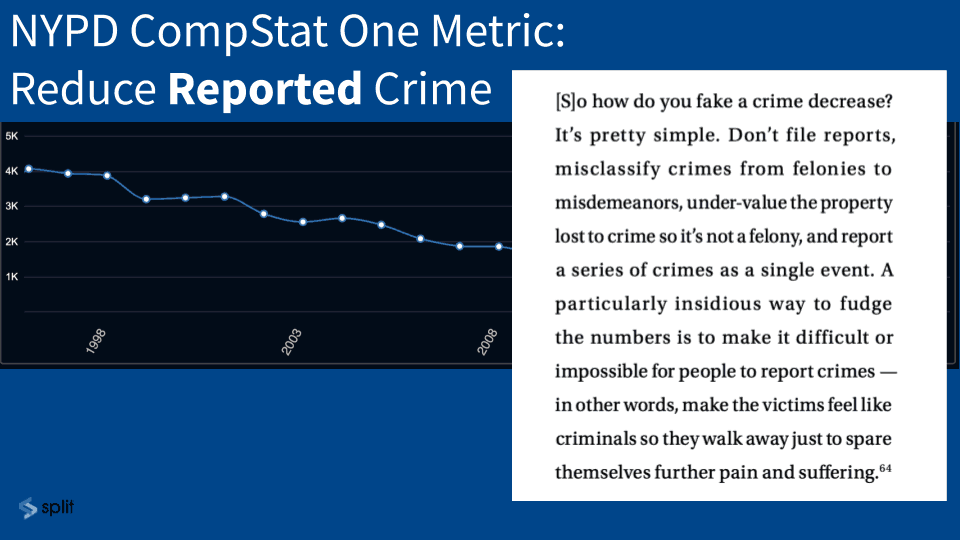
[00:16:01] If you look at what happened, and this is an unfortunate topic, but this is the thing that gets the most attention: This is this was the reporting of sexual assaults.
[00:16:11] Here we are in 1998 and it seems like it’s getting better and better and better. The problem was… This was one of the police leaders (not an executive but an actual policeman’s union person):
[00:16:25] “How do you fake a crime decrease. It’s pretty simple don’t file reports. Misclassify crimes from felonies to misdemeanors. Undervalue the property lost to a crime, so it’s not a felony. And the worst part here particularly insidious way to fudge the numbers is to make it difficult or impossible for people to report crimes in other words make the victims feel like criminals so they walk away just to spare themselves from further pain and suffering.”.
[00:16:47] The expectation is that the underreporting is like 2 or 3 or 4x. So the stats got better, but they got better because the entire organization was incented to make sure people didn’t report crimes not to reduce the actual incidence of things going wrong.
[00:17:06] Basically they realized, the commissioner realized afterwards, that they were ignoring the measurement of core functions and they were paying attention the highest priority, public satisfaction. They were stuck on one metric that didn’t actually reflect what their charter was.
[00:17:22] Who here has heard the term, guardrail metrics?
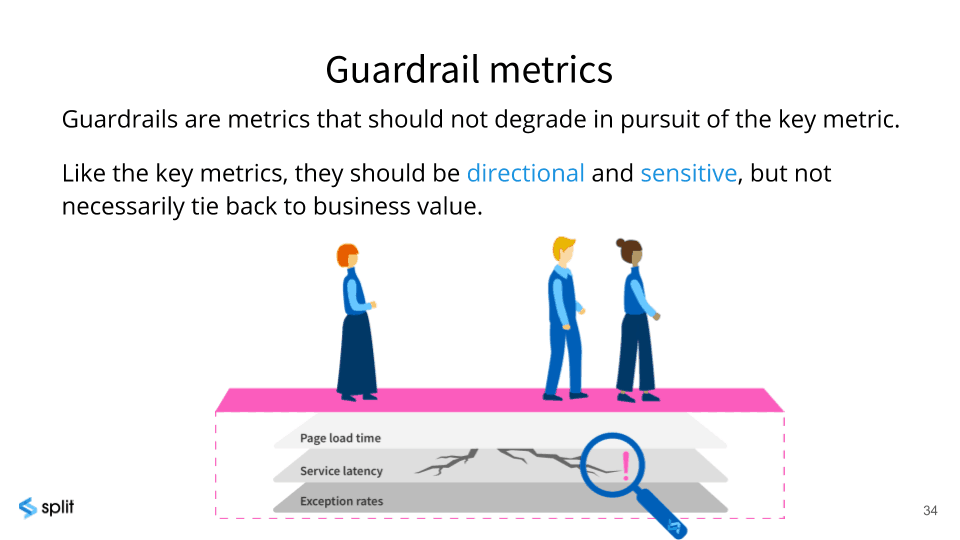
[00:17:25] OK cool. Great. So the idea with guardrail metrics for those who haven’t heard it is just I’m going after metric X like this case the Airbnb people are trying to get more hosts to sign up, but I also want to make sure that I don’t crater other important stuff. I want to make sure that I don’t intrude errors. I don’t want to add latency to the page. I don’t want to have people unsubscribe to something.
[00:17:47] Guardrail metrics are things you want to watch alongside your key metric so that you don’t hurt things. And again you can get kind of fixated. If you’re a team, you have a job. You’re trying to make something better right? So I call that the local optimization problem. Your incentive is to make something happen, but you shouldn’t slow down the page for all users just in the effort of getting more clicks or something. Gardrail metrics are other things you should be watching while you while you do your experiment.
[00:18:15] And this one’s interesting. And again I think there’s a fair number of you who are into stats you know this.
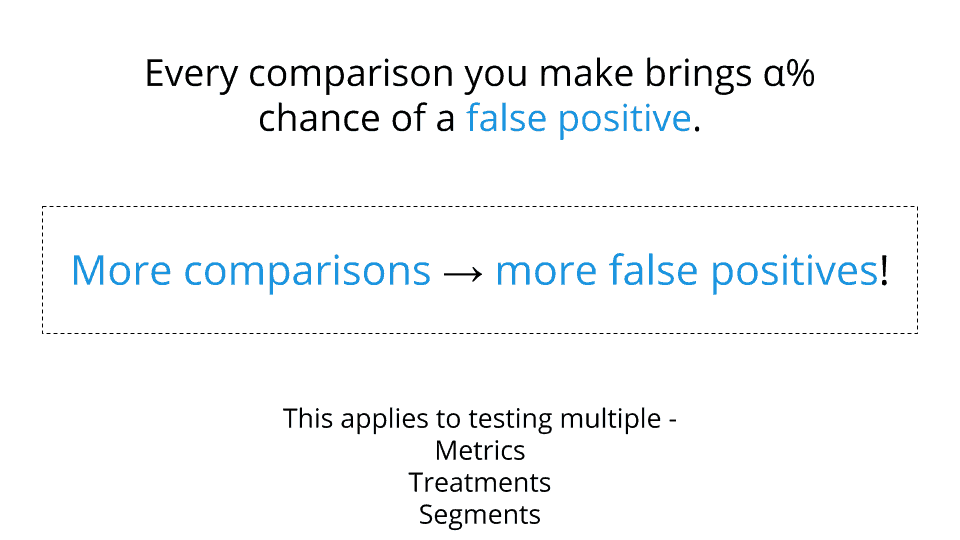
The more stats we put up and look at, the more likely one of them is going to flash a false positive. If I have a 5 percent chance of a false positive and I put 20 metrics on the screen… if I get 20 of them and it’s 5 percent chance one of em is gonna be positive by totally random nature, it’s going to come up positive. It’s sort of OK to have them up there, but it’s really important to not say, “Look! We improved! We were going after this and this, and you know we didn’t change that at all, but we did improve this thing.”
[00:18:55] So if you’re looking at too many things you can actually again be subject to bias; you can actually gravitate onto something that’s not statistically valid.
So this is an example, just with numbers. The chance of a false positive with a 5 percent chance per metric. When you’ve got two metrics, that’s a 10 percent chance it goes up and up right. And if you if you get to 10 metrics, were already up to 40 percent chance that you’re going to think you won when you haven’t. So, it’s important to focus on key metrics and not be deceived by thinking that you moved something else randomly and that you’re a hero.
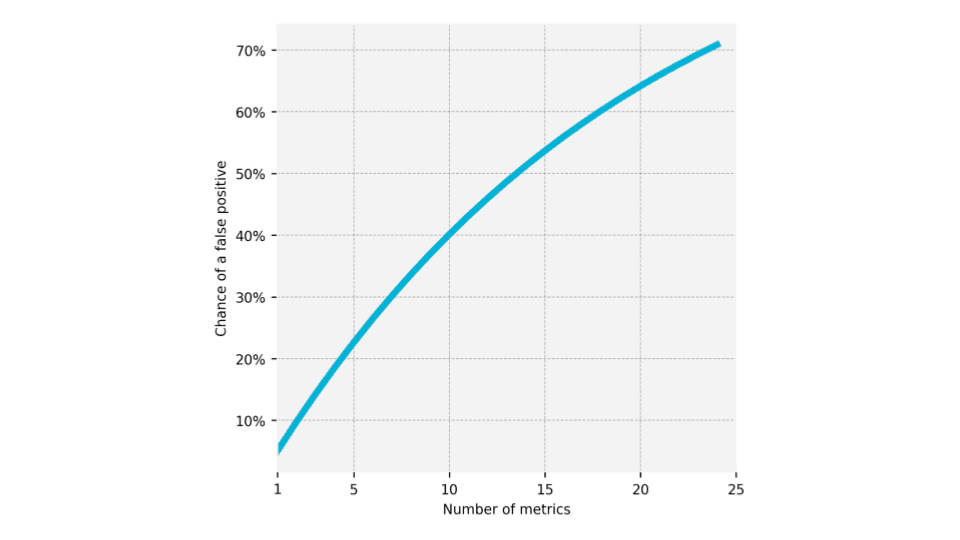
[00:19:29] And I hope I hope this doesn’t sound depressing. One of the takeaways from experimentation is it can be kind of hard and you often won’t actually crush it, but that’s why we get good at doing this and try to do it as often as we can, so we can win.
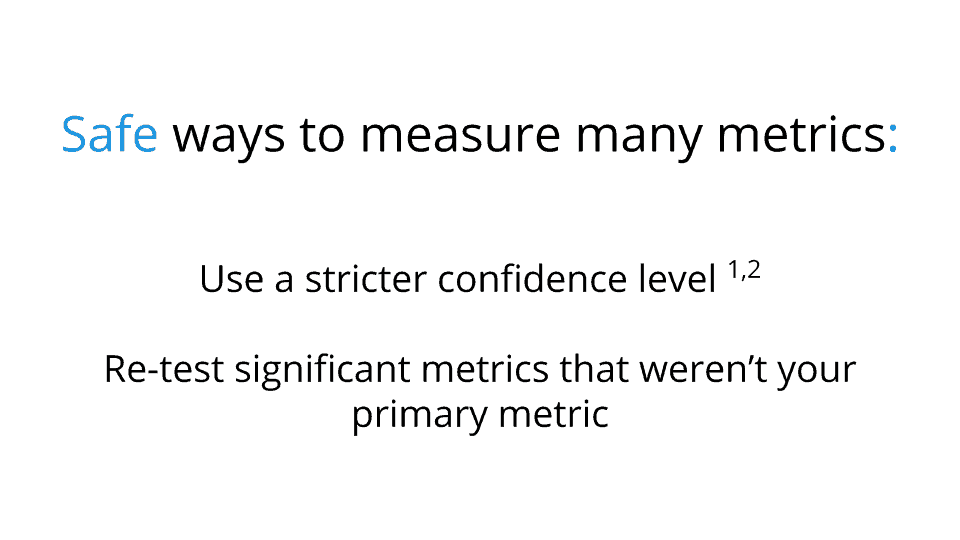
[00:19:45] If you are going to have a lot of metrics then you want to tighten down your confidence level which means you need more power and we’ll talk about power in a sec, or you want to retest something which you thought looked interesting: Create a new hypothesis that focuses on that one box that turned green or whatever and retest that as its own experiment to prove it it’s true.
[00:20:04] It’s amazing how many times people won’t actually do power analysis. They’ll just run some sort of a test of some sort of size and if some of the metrics look interesting they’re kind of excited.
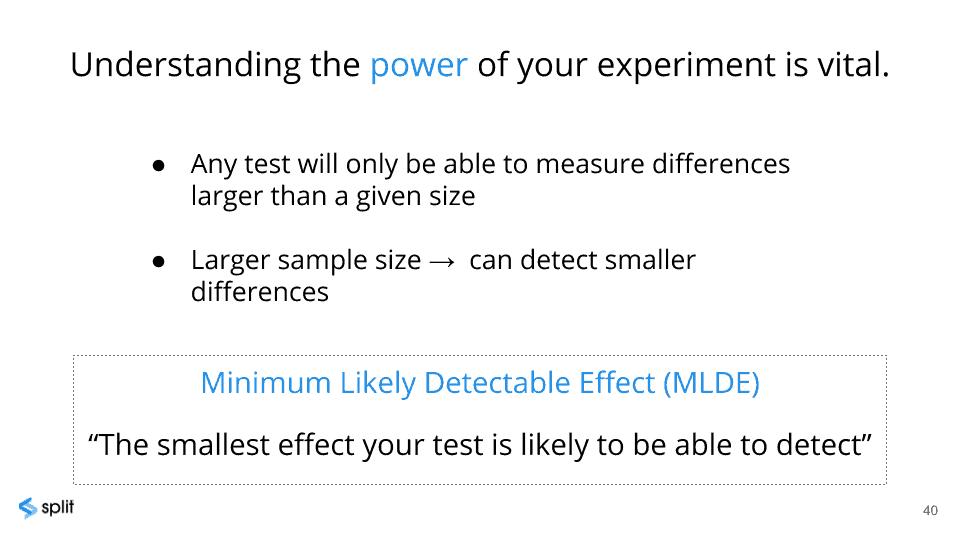
The thing is, you need to actually realize how valid your data is based on how much traffic you’re going to send through. If you’re working with your home page or your start of your app you’ve got a giant population. If you’re working on an obscure feature that’s three clicks down somewhere, the number of people that pass through there is probably much smaller, right?
[00:20:29] So you need to focus on power. You want to make sure that you understand the minimum likely detectable effect. The main inputs are how many people are flowing through this and how much variance is there in the data. How random and bumpy is it?
[00:20:52] Here’s an example of a sample size of a thousand users.
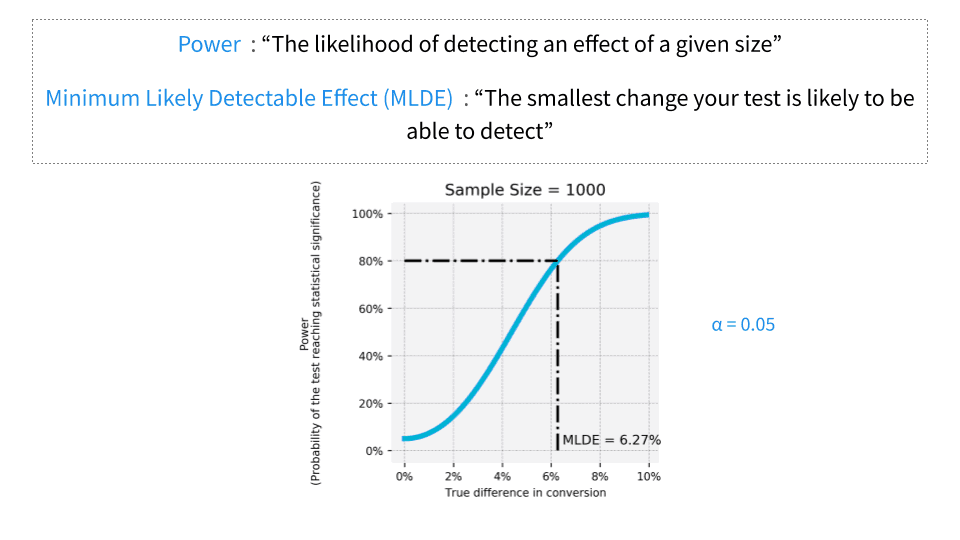
In this case the minimum detectable effect in changing a metric is 6.27%.
If I have a hundred thousand users passing through, the minimum detectable effect is 0.63%.
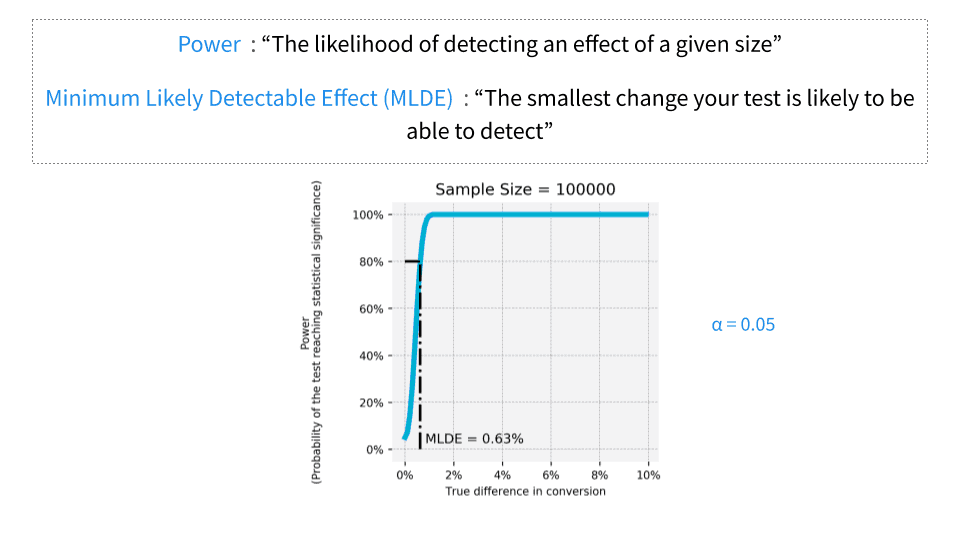
I can have a tiny little lift in something and it’s valid. I can actually trust it. But if I am only going to put a thousand people through an experiment, I’ve got to make a huge difference. Otherwise, I’m just playing around in this area where the outome could be totally due to random noise. Not actually meaningful. “Oooh! We made a 5 percent improvement!” Well, that’s actually not valid. That doesn’t mean anything. If it’s a 5 percent boost with that population, it’s within the realm of, “nothing happened.”
[00:21:39] Business cycles. Last night we had Tinder on stage. Tinder probably is busier towards the weekend than they are on Monday morning. Right? So you don’t want to run your experiment for three days… Or there could be a news event that happens in the middle of a three day experiment, right?
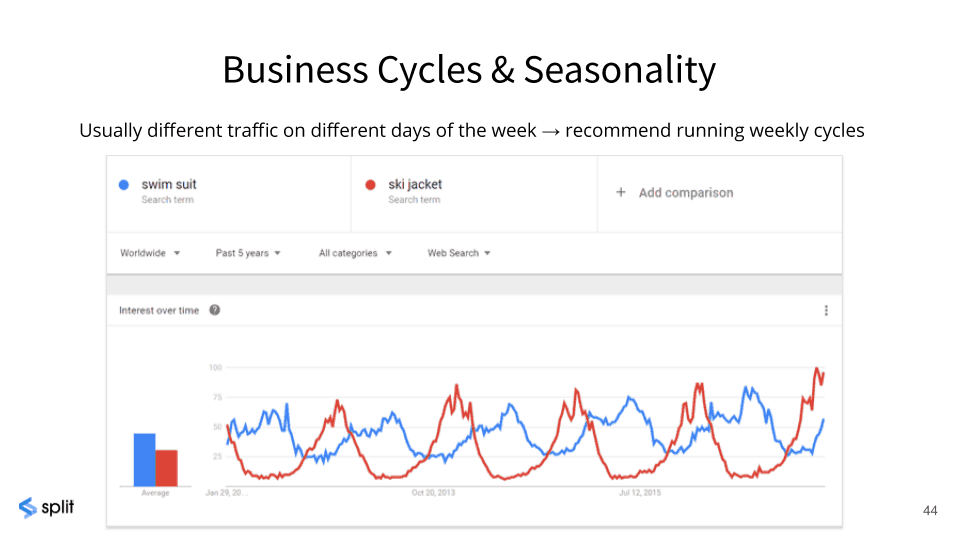
[00:22:09] You need a little more time to make sure that you’re not being you know that you’re not missing out on something. So just take into account, what is the likely seasonality, and hopefully have a lot of analytics on what your customers do and you know those patterns. Just be sure to zoom out and make sure you’re not running an experiment that spans odd events or doesn’t capture odd events. So typically two weeks is good because you get the weekends and the weekdays depending on what your model is, is usually pretty good.
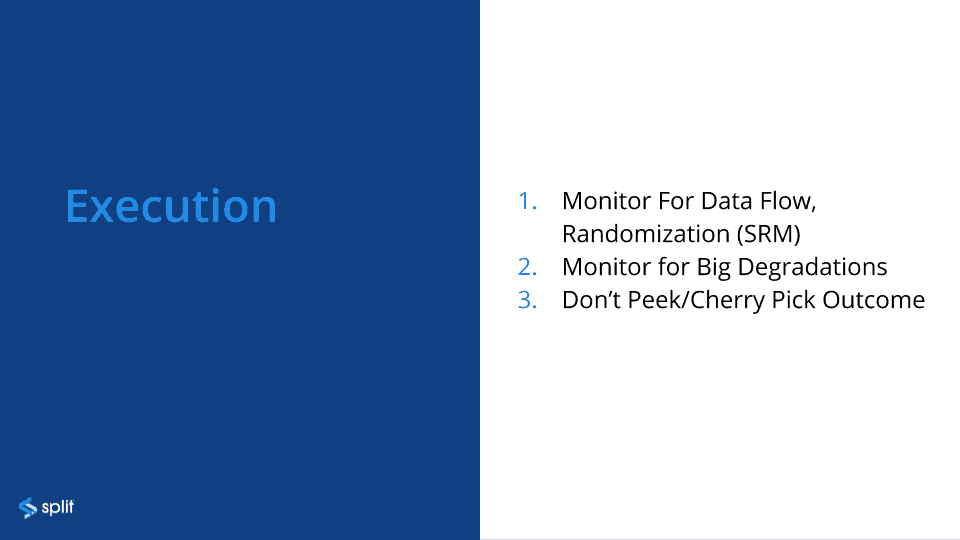
[00:22:46] When you’re running a test, who here knows that peaking is bad? OK. And I think we know peaking is bad because if you peak you’re more likely again human bias you are more likely to fall prey. If you see something you like and you’re not really through the interval you thought you’re going to go through, you’re gonna go, “Ooh! Look. It’s awesome. Let’s quit the experiment! We’ve already proved our point.”.
[00:23:07] There’s a weird thing which is that you do need to monitor for big degradations, but you don’t want to peek or cherry pick the outcome. So things to watch for:.
[00:23:19] Data flow. This is just, “I’ve started my experiment, am I getting data?” If I’m going to a wait two weeks I better make sure that I’m actually getting data. I don’t know if this has ever happened. I don’t think I want to know the answer. This can happen if you have instrumented and you’ve goofed somewhere.

If you read the Microsoft papers they write, that they had a lot of issues early on with instrumentation that wasn’t what they thought it was, and so they would run an experiment and they didn’t have the data they thought they were gonna get. So they had put a lot of time into that.
[00:23:45] Randomization. So SRM stands for sample racial mismatch and we’ll talk about that in a second. So super basic thing. I know this is crazy but don’t just hit go and then be disciplined have to walk away for two weeks. You need to make sure that the data is flowing and then make sure randomization worked as targeted. This is a screenshot out of Split’s product, which is saying, “Hey, you were going for 50 percent on and 50 percent off and right now we’re seeing 50.34% and 49.66%. We’re doing the stats, and they are saying that’s fine. You are flipping the coins and they’re the way they should be.
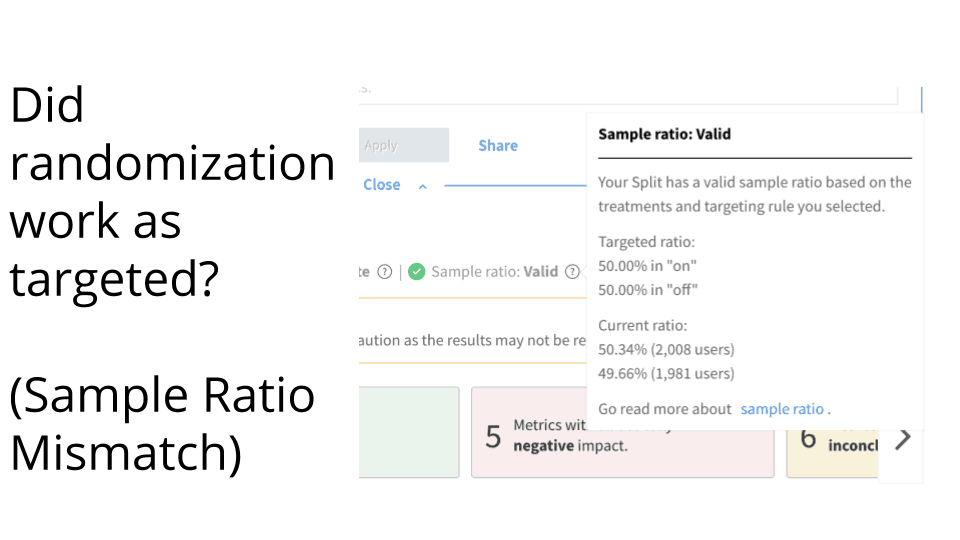
[00:24:19] So, have some way, whether you have to do this by hand or whether you have it in your system whatever, have some way to basically calculate whether the targeting worked out like it should. Because if you’re off by a lot, then there’s something else biasing your data. And again we’re always trying to remove bias, right? So have a way to check for sample ratio mismatch.
[00:24:35] Then, this is that that tricky thing, which is monitor for big degradation. You don’t want to freak out about minor changes in what looks like the business outcomes as long as they’re not drastic, but you should be looking for crazy stuff like errors out of band crazy latency etc..
[00:24:55] You want to catch that, but you don’t want to peek.
So if you’re if you’re peeking…
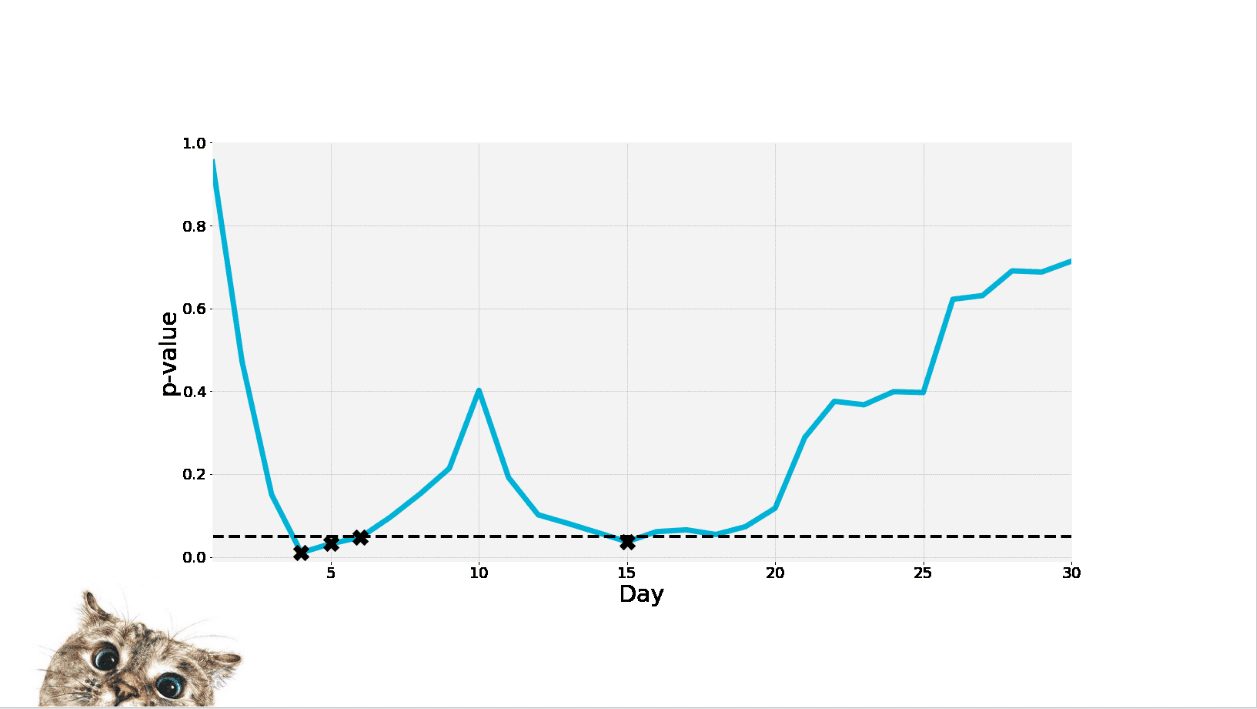
This is an example of a p value that’s changing based on how noisy the data is and it changes. Everything was kind of lining up and there wasn’t much variance here and so it looks like you’re doing really well. But over the course of the experiment basically the data was pretty noisy and so you don’t want to come in and say, “Wow everything’s super consistent and we’re winning!” and quit.
[00:25:26] The last thing I want to get to is analysis.
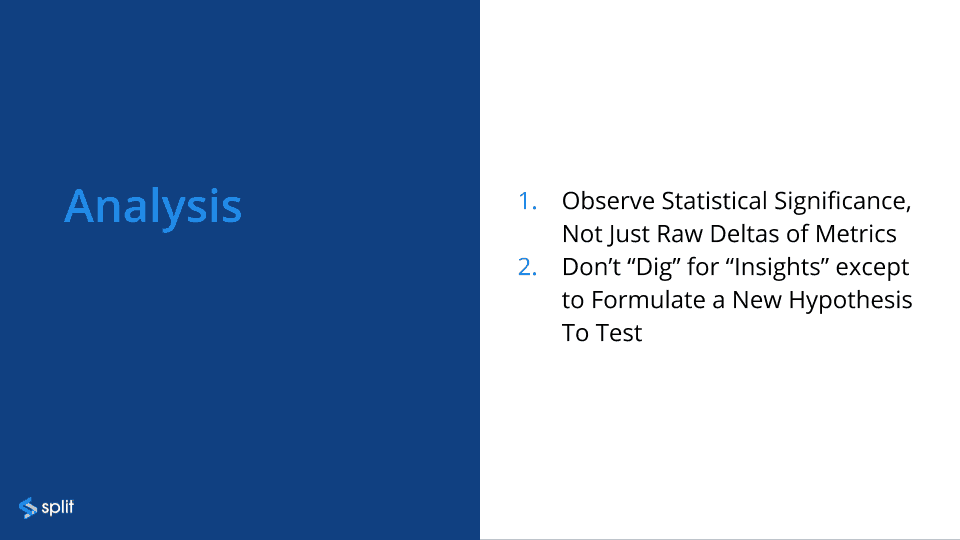
[00:25:32] This is a problem that we see over and over again, which is that people will look at metrics, without considering p value or any other measure of how valid that metric is and say, “Look! We’re 5 percent up or we’re 10 percent up. It’s green! We’re great!” Maybe it goes without saying but you really have to make sure that you’re looking at both things: you’ve got to look at not just what the metric on the dashboard is telling you but, “Can I trust that metric?”.
[00:25:55] Then, don’t go digging for insights except to formulate a new hypothesis. After you’ve done your hypothesis and you’re running your experiment, either during or after. Don’t go poking around to figure out whether you’re successful or not using metrics that weren’t in your original plan, except to say, “Oh! That’s interesting. We weren’t really looking for this but I think that’s interesting, I think I’ll formulate another experiment.” Yes it takes another cycle. But the problem with actually digging and finding something that looks compelling and saying that’s a win is that again you’re way too much subject to human bias.
[00:26:32] This is a slide my colleague put in here about about flipping a coin and this is just for again this was kind of this slide was really intended for people that aren’t that familiar with statistics which is you know if you if you flip a coin a hundred times and you get 45 heads and 55 tails, you know that’s a fairly reasonable outcome.
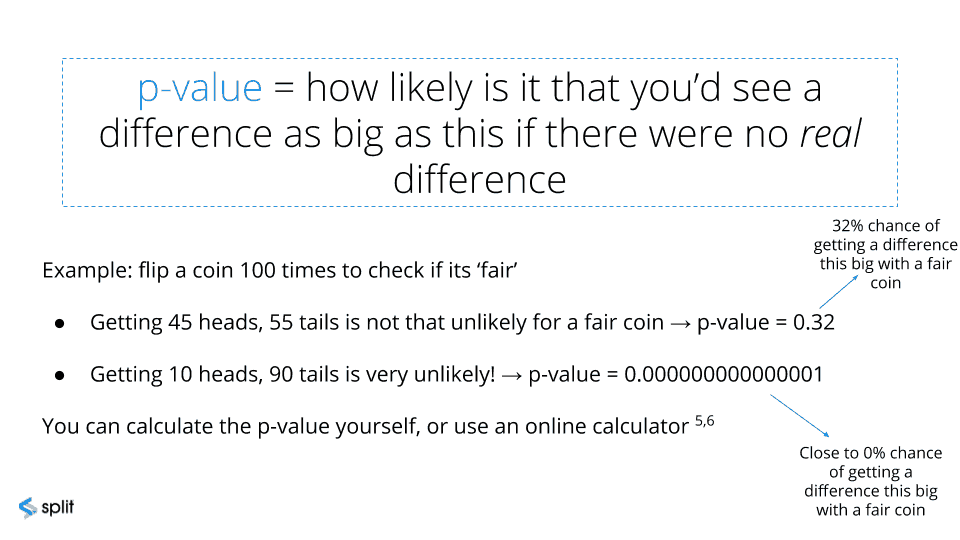
But if you get 10 heads and 90 tails that’s a so unreasonable that you know that the coin is is corrupt. Right. But there’s still a 32 percent chance you know that that this is 32 percent chance of being OK. You have to calculate this stuff, whether it’s built in your system or whether… if you don’t stop to realize what this raw number on the dashboard is showing you means, then then you’re really not doing an experiment.
[00:27:18] So in this case the Airbnb people had their cohorts go through here and they calculated and then the p value was .012283 which is pretty awesome.
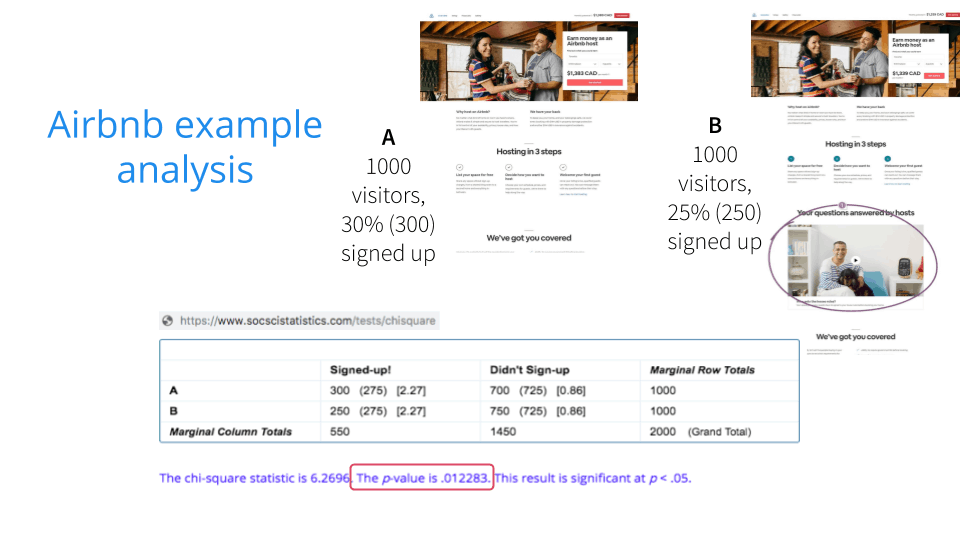
That’s basically a little bit more than a 1 percent chance that they’re getting that the the findings they got were only due to random nature so it’s pretty solid.
[00:27:35] I don’t know what you guys use for Stat Sig, five percent is pretty typical but when people have super high numbers, they will typically go for even more tight ones. The Microsoft guys are very… It’s amazing to have the system they have, but they’re so rigorous about what they do. That might be kind of frustrating. I would think, “Oh yeah great! You proved that. Super. Just repeat it again so we can be really sure that you proved that.” I think I’d go a little crazy.
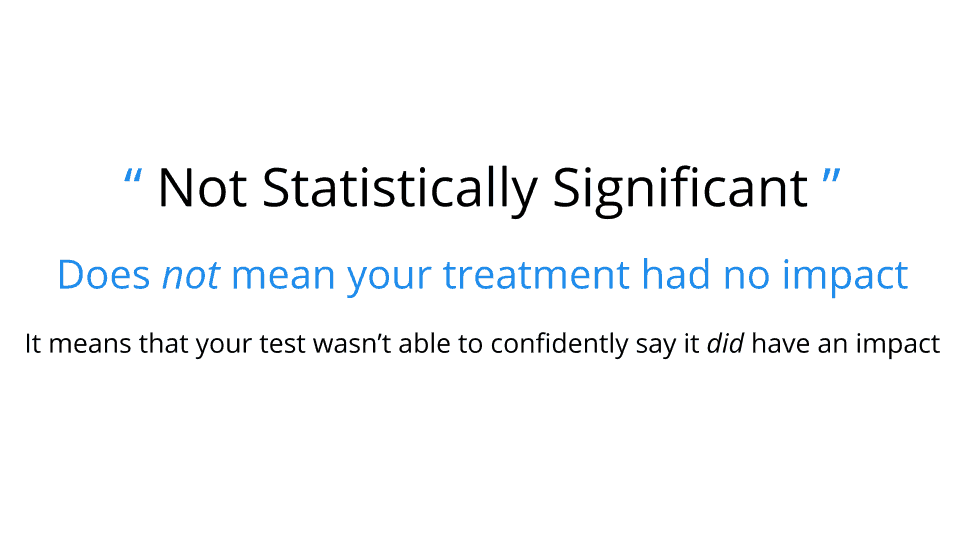
[00:28:07] The last thing is that it’s OK if you don’t get Stat Sig and get something directional just don’t consider it enough of a signal to make big changes. But you’d be basically gotten some input.
[00:28:22] This is where I’m pointing out, don’t dig for insights, except to formulate a new hypothesis. If you if you want to dig through the data, that’s great, but be sure you’re doing that as a research project, not as a way to save your experiment.
[00:28:35] If you’re experiments show that nothing happened or that you couldn’t find conclusive evidence, don’t go looking for things that you can say you just proved. You can go looking for things, but make sure you do that formulate another experiment.
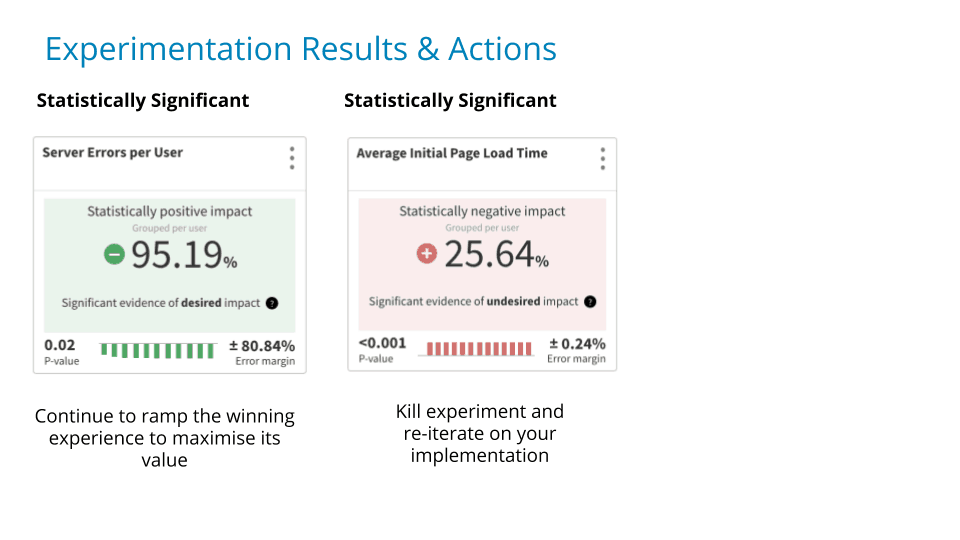
[00:28:46] Here’s an example of what you do with the results right.
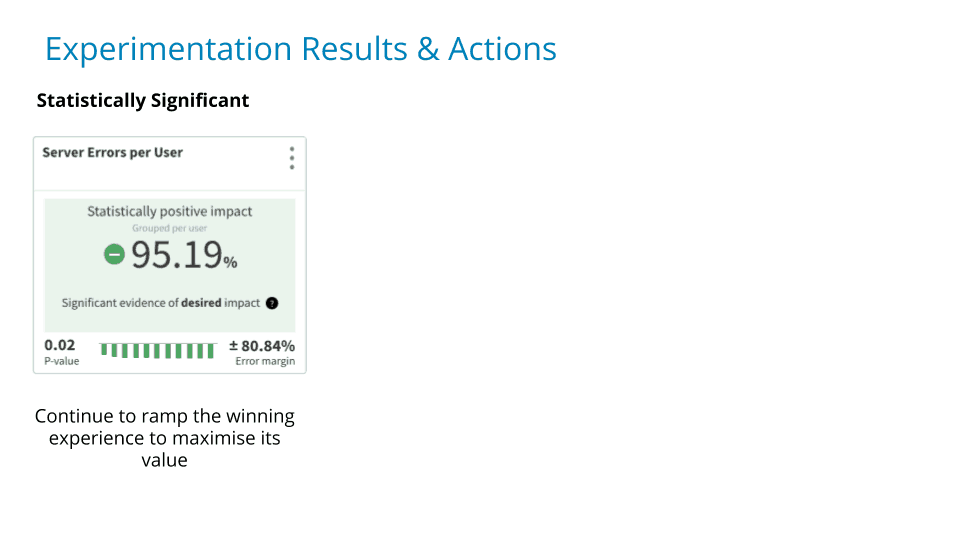
So hey! This is looking good like huge impact super low randomness to the data. Go for it! Ramp that up and ship it out.
[00:28:59] Here’s an example of a very negative impact, definitely not due to random stuff, so kill it and iterate.
[00:29:09] This is the one that people get a little more confused about which is that, it’s not really physically significant, but it’s interesting.
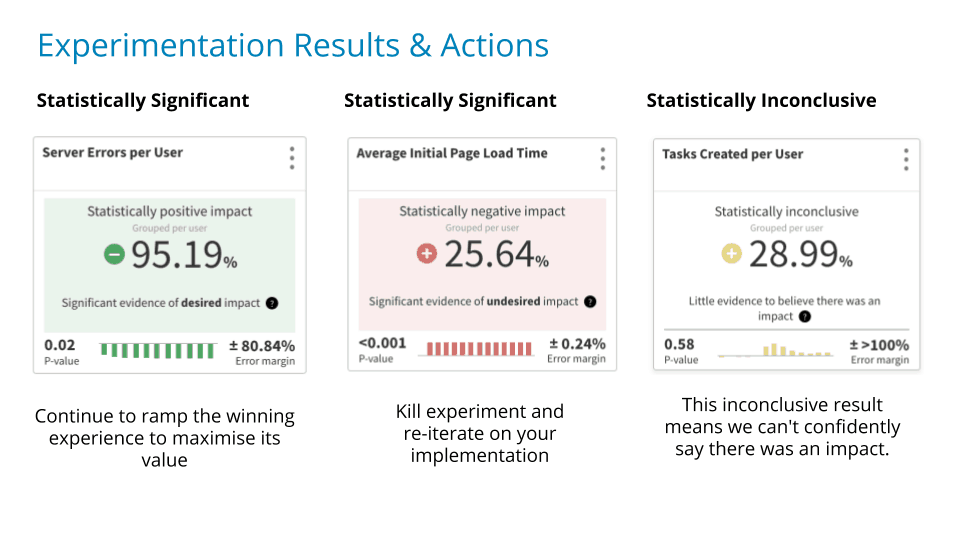
That’s a big still a big lift in this this number, but because it’s about a 50 percent chance that it’s not meaningful, you don’t necessarily want to roll with that and say it’s a fact. You probably want to find a way to prove it better. So, you probably want to iterate.
[00:29:33] I know that was that was kind of a lot of high level stuff. My goal was to start a conversation about, how sometimes we get focused on how we run our experiments or some of the mechanics and we don’t think about these these kind of core principles.
[00:29:53] I’ll do a quick wrap up here on some of the high level stuff and then we can do a Q and A really quick.
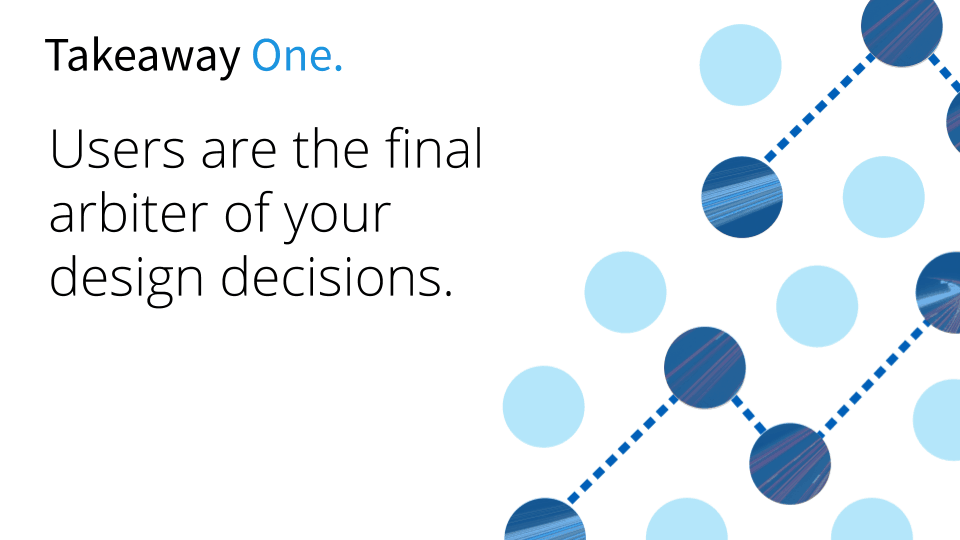
[00:29:57] So sometimes we forget, yes we’re trying to be very smart and we’re trying to build really good stuff. An experiment is one of ways we prove… Ultimately if you sort of cheat or if you fudge the numbers or find a way to game the system, you’re just delaying finding out whether something really works.
[00:30:18] The users are going to tell you eventually with their behavior.
So let’s just watch how the users vote with their actions rather than a focus group.
[00:30:28] To get meaningful output, to actually have something you can take away and take to the bank, we just have to follow a few principles. We have to follow a few core principles and it might be useful to remind yourself like once a week (or whatever I don’t know what interval would be for you). If you’re running stuff, ask, “Am I cutting corners anywhere here? Am I leaving myself open to getting led astray?”.
[00:30:53] The other takeaway is that if you if you do this stuff well, even if you don’t win with stats, if you don’t prove that you crushed it, if you learn something in the process, then it’s a successful experiment.
[00:31:05] I don’t know what your batting rate is.
[00:31:08] To hear Ronnie describe it at BING, once they’ve optimized and optimized and optimized, the chance of them actually moving the needle with an experiment is crazy low, so it’s kinda like doing biotech research: you might work for five years and actually not have anything to show for it.
[00:31:21] Then, one day, you do something amazing. The thing to remember is that is that if you’re learning and if you get better at doing this reliably, faster, then you’re going to move the needle. Sometimes it’s hard, but it’s worth it if you can get it done. On that note I’m actually going to switch into Q&A. Are the people remote able to ask questions or how do we do that?
[00:32:01] Hopefully that that that gets some thoughts going in your head!
Aidan Crook [00:32:06] Let’s just Thanks Dave for an awesome talk first.
[00:32:08] Applause.
Get Split Certified
Split Arcade includes product explainer videos, clickable product tutorials, manipulatable code examples, and interactive challenges.
Switch It On With Split
The Split Feature Data Platform™ gives you the confidence to move fast without breaking things. Set up feature flags and safely deploy to production, controlling who sees which features and when. Connect every flag to contextual data, so you can know if your features are making things better or worse and act without hesitation. Effortlessly conduct feature experiments like A/B tests without slowing down. Whether you’re looking to increase your releases, to decrease your MTTR, or to ignite your dev team without burning them out–Split is both a feature management platform and partnership to revolutionize the way the work gets done. Switch on a free account today, schedule a demo, or contact us for further questions.
