
It’s easy to think of the user interface as the primary target for new functionality, with product teams eagerly watching important business metrics such as conversion rates and user engagement for improvements after each release. But behind the scenes, engineers are continually working on server-side innovations such as changes in machine-learning algorithms or performance enhancements that can directly impact user experience. By the same token, there are often server-side changes that are not intended to affect users, so the goal is to ensure a consistent user experience before and after the change.
The only way to understand the impact of these changes is to measure. Did application performance go down or error rates go up with that last change? Has there been a negative impact on other applications?
If you’re not looking and measuring, you’re just hoping that things are the way you expect. And in the immortal words of Vince Lombardi, ‘Hope is not a strategy.’
Experimentation from Split gives developers the ability to observe movement in KPIs for application changes anywhere in the stack. That’s because our feature flags and experimentation engine tie the negative or positive movement of engineering metrics back to the original changes that are causing them to move.
By measuring the impact of server-side changes, dev teams have the confidence to proceed with a rollout, and peace of mind that a single click will turn off problematic code. If you’re thinking about measuring your backend changes, here are some things to consider:
To release or not to release, that is the question
Feature flags protect the user base from a negative experience by helping dev teams implement risk-reducing techniques such as testing in production and gradual rollouts. The tricky part though is that when exposing a feature to a small percentage of users as part of a low-risk phased rollout, you probably aren’t going to see any movement in your big application performance management (APM) dashboard. Everything seems fine, so you increase exposure to more users. By the time you have a large enough user base exposed to see movement in your APM dashboard, too many users have been exposed to the problem, which defeats the purpose of a phased rollout.
When you measure in a feature-driven context in Split, you can identify issues long before they become a problem for a significant portion of your users. Evaluating application metrics at each phase of the rollout means developers can assess the success of change and determine if the deployment should continue.
Death by a thousand cuts
Depending on the specific change, the objective may be to simply ensure metrics don’t move at all, leading to the desired conclusion that the change is sustainable and ‘does no harm’ to KPIs like page load time or error rates. But if you are continuously deploying change after change without measuring KPIs, you may not notice that performance has been getting a few percentage points worse, feature by feature.
You eventually succumb to ‘death by a thousand cuts,’ where you know you have a performance problem but can’t identify a specific bottleneck. In reality, there’s a bunch of small bottlenecks, so there’s not a clear solution. Discovering these small decreases in performance through measurement may not keep you from releasing your changes, but it will help your team elevate identify issues sooner and more precisely, so you can get ahead of the problem.
Here’s an example: We had a customer who measured the number of database calls as new features were being safely rolled out to a small percentage of users. They spotted a meaningful increase in database calls and were able to take quick action to reduce the load on the database by adding a cache to boost query performance at scale.
Finding unintended side effects and unexpected benefits
To understand the broader implications of server-side changes, dev teams also watch for deviations in the metrics for other projects and even business KPIs on a feature by feature basis. The obvious implication for these guardrail metrics is to identify any unintended side effects, but you also might discover unexpected benefits.
An e-commerce company we work with tracks company revenue for all major backend changes. From experience, they know change anywhere in the application stack can indirectly affect users and therefore revenue. If revenue moves by a certain percentage— determined by execs— then the results are escalated to the senior leadership team for review. No pressure there.
Post-mortem evaluation
Not all evaluations of engineering changes take place in real time. Post mortem reviews of application issues look at the impact of change, who was affected, start and stop times, and what mitigating action was taken. And when making changes to complex systems at rapid rates, elite operational teams may also want access to metrics within a feature-driven context, viewing results globally, geographically, by account, device types, etc. And a ‘you code it, you own it’ philosophy may require dev teams to continue to monitor feature stats post-release. Split keeps a changelog and metadata for what was released, when, to whom, if/when the change was disabled, all in one place.
Metrics that matter
Here are some common measurements that we see dev teams track in a feature-driven context:
Performance metrics within and across applications
- Service latency
- Page load time
- API response time
- Database load
- Performance of a new machine learning model
- Transaction rates
- CPU usage
- App crashes
Functionality metrics
- HTTP error rates
- Logged exceptions
- Thrown exceptions
- Server errors per user
Product health metrics
- Unsubscribe rates
- App uninstall rate
- Order cancellations
- Product return rates
- Help center visits per user
Defining metrics and monitoring outcomes in Split
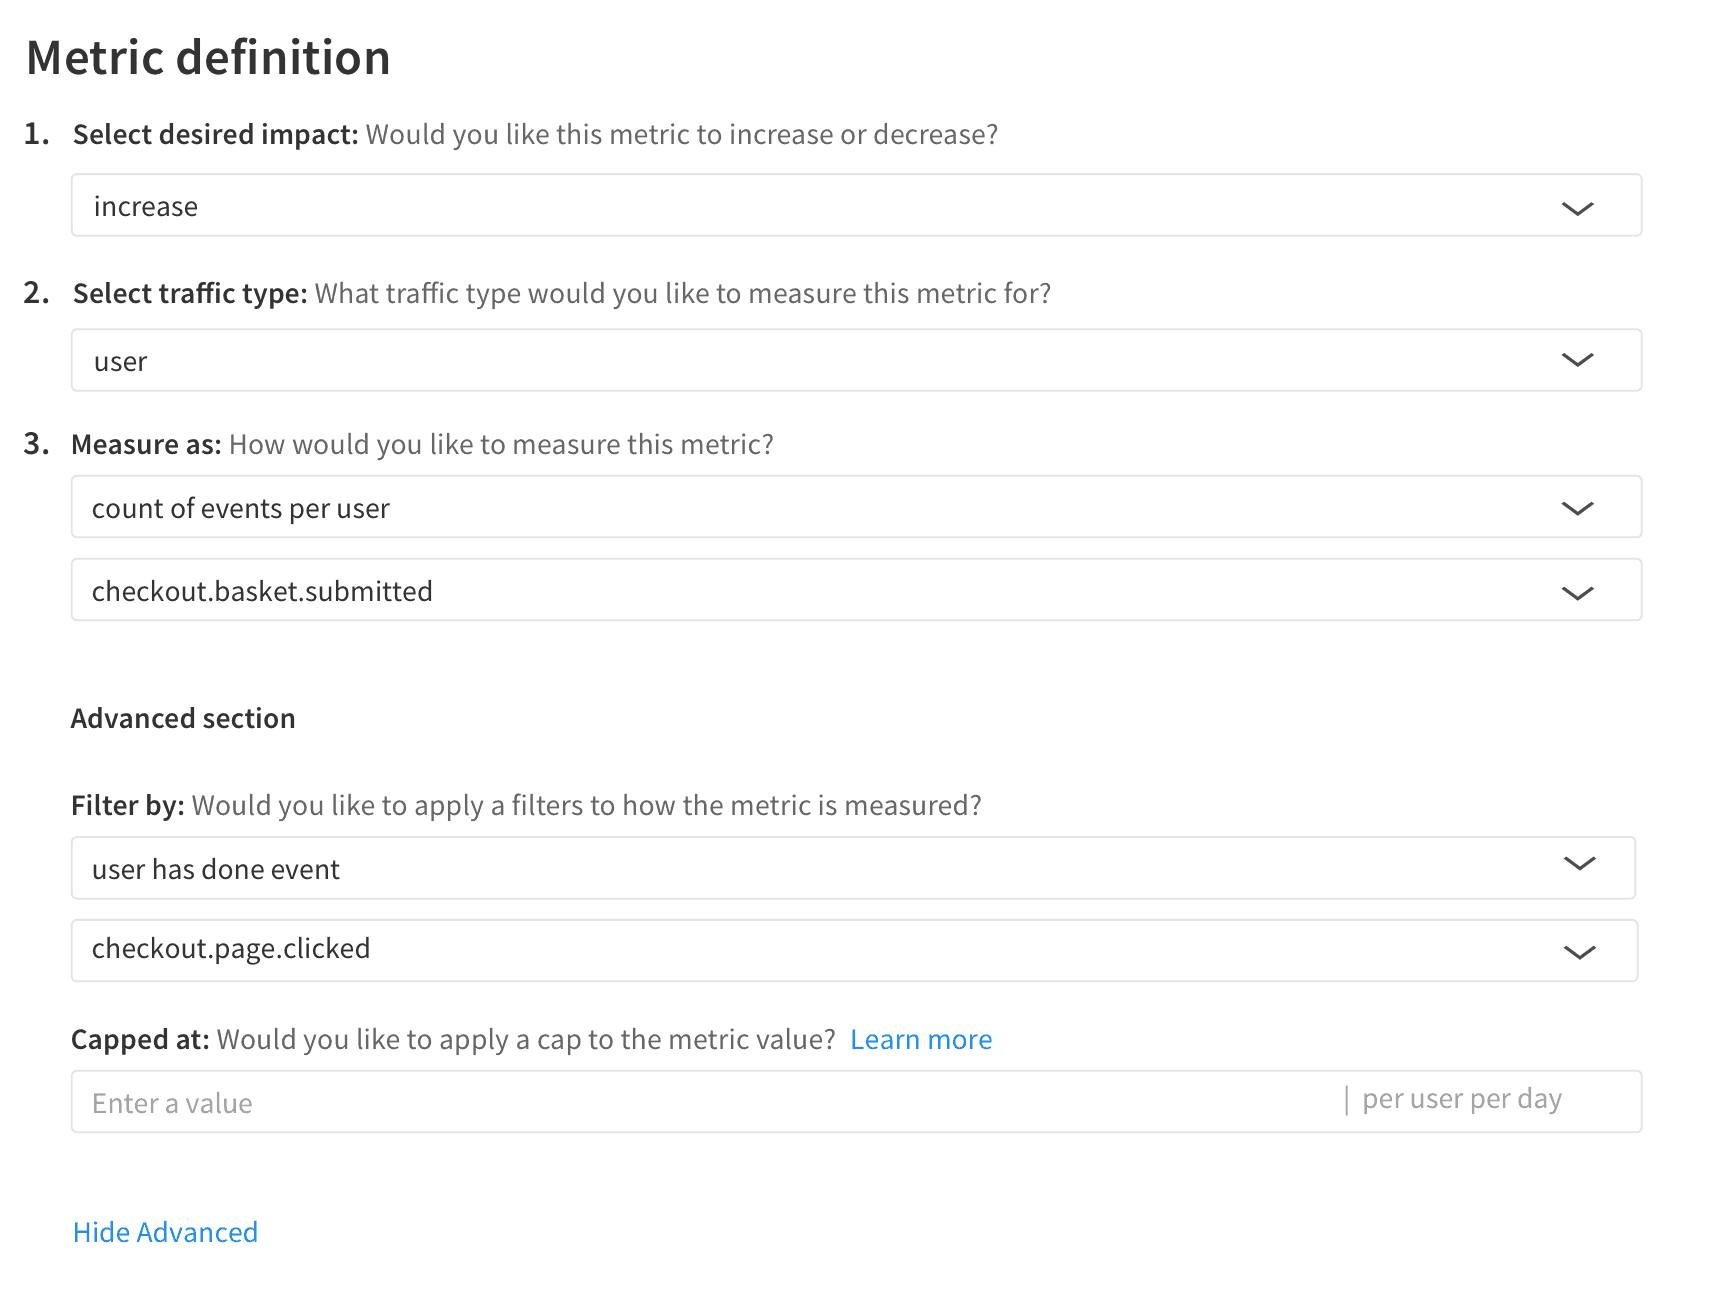
Defining a metric in Split is straightforward. Let’s use a page load time metric as a reference.
- First, select whether you would like to see this metric increase or decrease. You’ll see this preference reflected in the metrics summary dashboard.
- Next, select the traffic type, which will be either by user or across the organization.
- Finally, select how you want the metric to be measured (count, sum, average, etc.) for the event (Initial Web Load Time in the example below). Measurement can be per-user (statistical significance is calculated when data is collected on a per-user basis) or across users (used to describe the overall trend and behavior of a metric). Since we want to understand whether the change in the page load time is statistically significant between those users who have been exposed to the new functionality and those who haven’t, we will choose to measure average event values on a per-user basis.
Find out more about Split’s advanced statistical settings and metrics definitions in previous blogs.
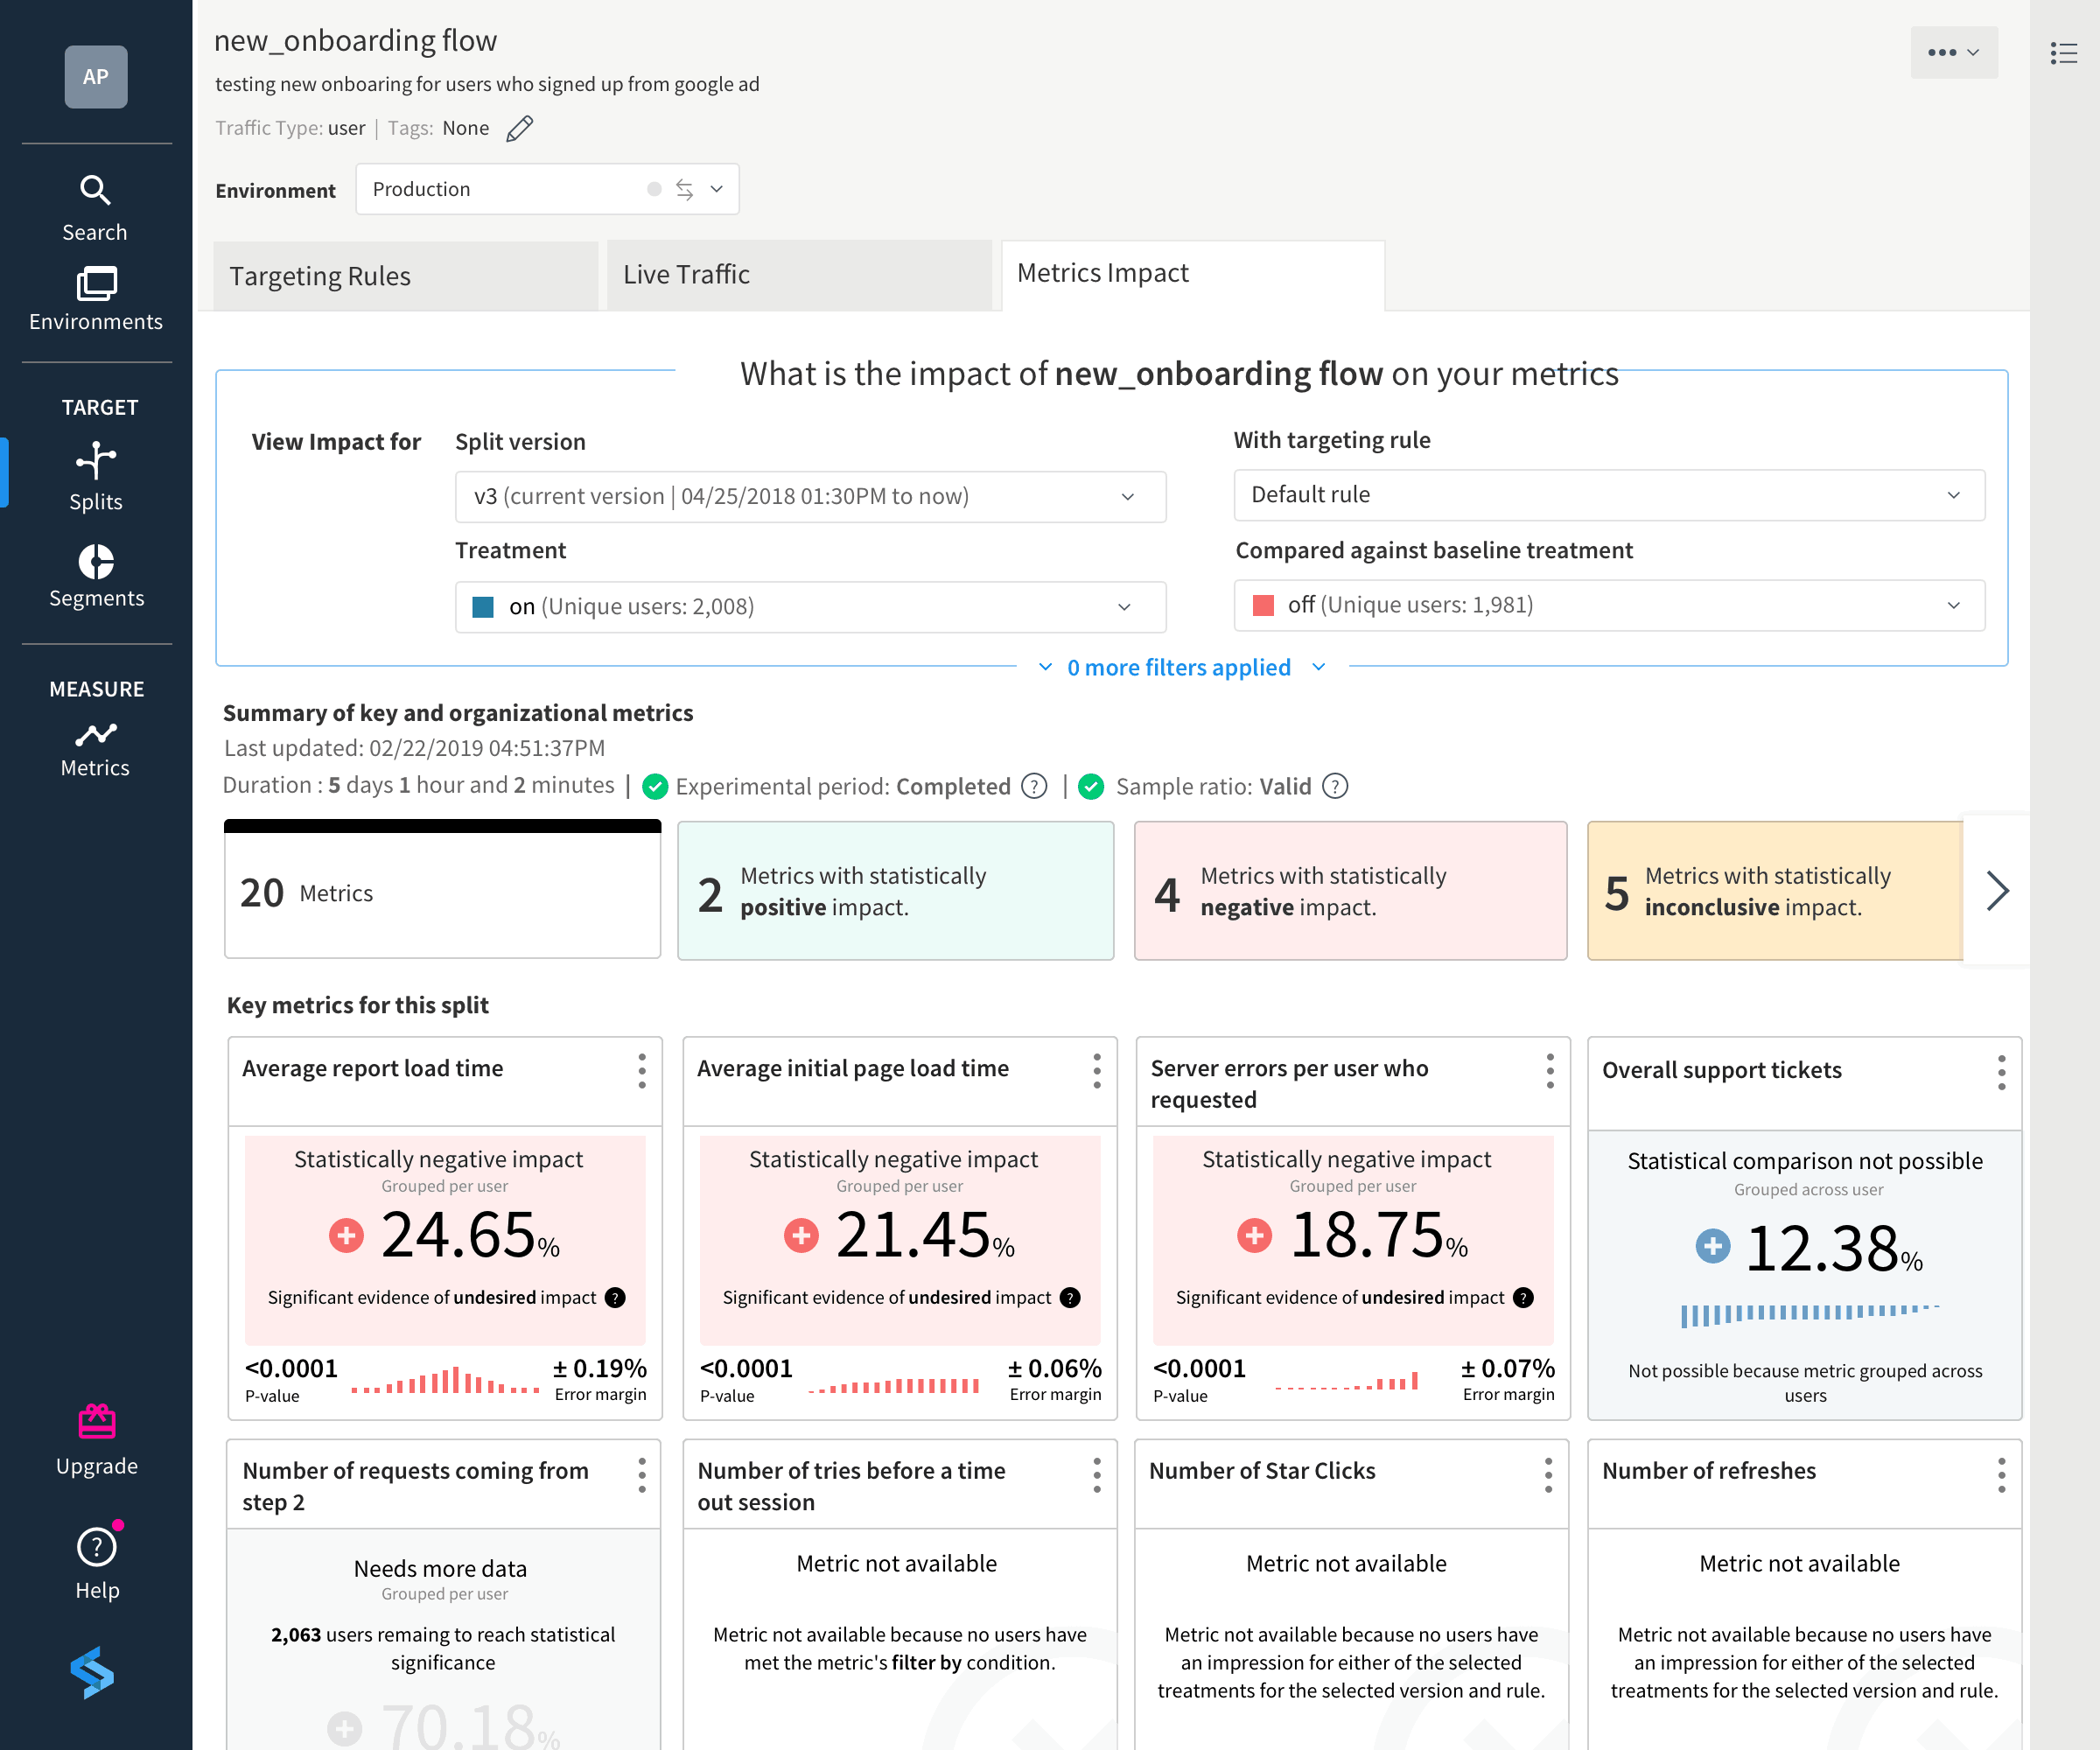
Observing the impact of change
Next, create the rollout plan that assigns treatments and targeting rules for your feature flag. Now you are ready to begin your experiment. As the experiment is running, Split’s metrics impact page provides a summary of each metric you have assigned to this experiment, whether they are application-specific metrics or organizational metrics.
When it comes to feedback from a feature change, we are interested in analyzing change from as many places as possible. Measurement with Split’s feature flags democratizes data so everyone can access the same information, in the same feature-driven context, to create a single source of truth.
Get Split Certified
Split Arcade includes product explainer videos, clickable product tutorials, manipulatable code examples, and interactive challenges.
Switch It On With Split
The Split Feature Data Platform™ gives you the confidence to move fast without breaking things. Set up feature flags and safely deploy to production, controlling who sees which features and when. Connect every flag to contextual data, so you can know if your features are making things better or worse and act without hesitation. Effortlessly conduct feature experiments like A/B tests without slowing down. Whether you’re looking to increase your releases, to decrease your MTTR, or to ignite your dev team without burning them out–Split is both a feature management platform and partnership to revolutionize the way the work gets done. Switch on a free account today, schedule a demo, or contact us for further questions.