
The modern Java developer is expected to shoulder a lot of responsibilities. Beyond implementing and testing new product features, more and more engineers are also expected to play a hand in production operations. One aspect of that is monitoring: tracking runtime performance metrics such as response latencies, error rates, and memory usage.
What Is New Relic?
New Relic is a SaaS company that provides a range of functionality including a suite of cloud-based observability and analytics products. These products help developers, operations teams, and organizations to monitor, debug, and optimize the performance of their web applications, mobile applications, and infrastructure. New Relic’s platform collects data from applications and infrastructure, including real-time metrics, logs, and traces, application performance monitoring (APM) allowing users to gain insights into their system’s health, diagnose issues, and improve application performance or conduct infrastructure monitoring. The platform supports a wide range of programming languages and technologies, making it versatile for various IT environments. .
New Relic is a product you can use to add monitoring to a Java service in a matter of minutes. New Relic also provides a sophisticated set of additional capabilities that you can grow into over time.
In this post, we’ll take a quick look at using New Relic to sleuth through a production incident and then walk through setting it up for a Spring Boot web service.
Unpack a Production Incident in Your Java Application with New Relic
Why would we want to add monitoring to a service? The primary motivation is to detect and respond to issues with that service in production, often referred to as an incident. When responding to an incident, we want to start with what, when and why: what is the issue, when did it start happening, and why is it happening. Let’s explore this concept in more detail with a concrete example.
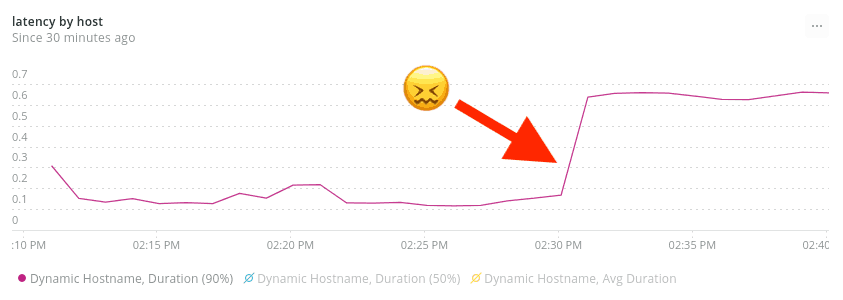
Brandy is a product engineer who works on a Java-based web service. She’s currently on call, “wearing the pager” for production support of that service. She’s just been informed that response times seem slow in production. She opens up the New Relic dashboard for her service to understand what’s happening, and immediately sees that 95th percentile (p95) latencies are up dramatically, starting around 2:30pm:
Brandy doesn’t see any deployments happening around that time, so she pings her team in chat to see if there were any other changes. Tray the Product Manager raises his hand, telling her that he turned up a new feature flag to 50% at around that time. This certainly sounds suspicious. Brandy investigates by graphing service response time grouped by the state of that feature flag, and finds a smoking gun:
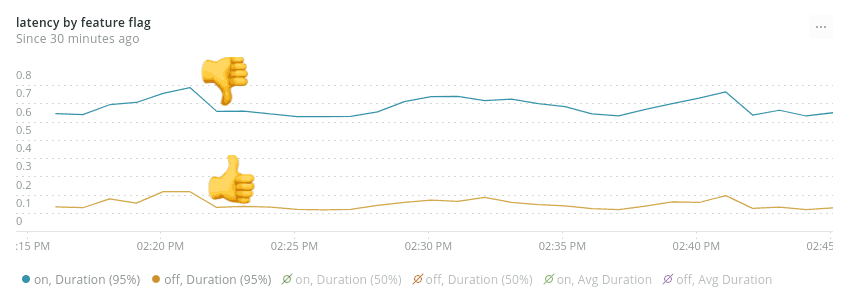
She can clearly see that requests with the feature flag on have a p95 of around 600ms, while requests with the feature flag off have a much lower p95, around 100ms.
Brandy asks Tray to turn the feature back down to 0%, and keeps an eye on the production graphs.
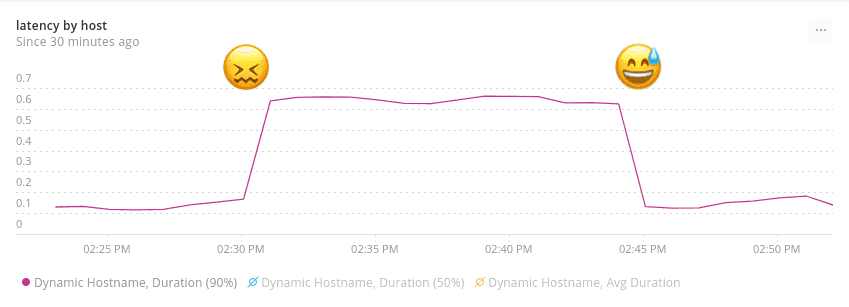
Looks like that did the trick — service latencies are back where they ought to be. The production incident is resolved, and the team can dig into the specifics of why that feature was causing a performance regression at their leisure.
This brief detective story shows how a monitoring tool like New Relic allowed Brandy to understand current state and past state for key performance metrics, and then slice and dice those metrics to gain understanding.
Set Up New Relic for a Java-based Web Service
Let’s look at how you’d go about adding this sort of monitoring to your own Java services. Specifically, we’ll be adding New Relic monitoring to a Spring Boot service which is running in Heroku.
This setup is extremely straightforward. New Relic uses an agent-based monitoring approach, which means you don’t need to make any code changes at all unless you want to use advanced features like custom instrumentation.
Download the New Relic java agent .jar
First, download the jar file containing the agent from the New Relic website, and unzip the download. I’ll be doing this using the Unix command line.
From the root of your source repository, run the following:
curl -O https://download.newrelic.com/newrelic/java-agent/newrelic-agent/current/newrelic-java.zip
unzip newrelic-java.zipThis will create a newrelic directory in the root of your source repo containing the agent jar file, along with some other supporting files. While it’s not normally a good idea to check compiled jars into source control, you should make an exception in this case and check the entire directory into source control. This ensures that a consistent version of the agent is in use, and also makes deployment to platforms such as Heroku extremely simple.
Inject the New Relic java agent into your process
Next, we need to inject the agent jar into our JVM process so that it can instrument our service, by passing an extra argument to the java command that launches the server process. With a Heroku-hosted app that’s done via the Procfile. The standard Procfile for a Spring Boot application in Heroku looks like this:
java -Dserver.port=$PORT $JAVA_OPTS -jar build/libs/*.jarWe just need to add a -javaagent argument, like so:
java -Dserver.port=$PORT $JAVA_OPTS -javaagent:newrelic/newrelic.jar -jar build/libs/*.jarThat’s all that’s needed. You can verify whether the New Relic java agent is now being successfully injected by running the app locally:
heroku local webYou should see log entries similar to:
com.newrelic INFO: New Relic Agent: Loading configuration file "./newrelic.yml"
com.newrelic INFO: Using default collector host: collector.newrelic.com
com.newrelic ERROR: license_key is empty in the config. Not starting New Relic Agent.This shows us that the agent is successfully launching, but as you may notice it’s complaining about a missing license key. This leads us to the next and final stage of setup — configuring the agent.
Configure the New Relic java agent
We can pass configuration to the New Relic java agent in various ways — via a configuration file, environment variables, java system properties, or via pointy-clicky server-side configuration within the New Relic web app. Initially, we only need to specify a couple of configuration values — our license key and our application name. The simplest way to do that is via environment variables. We can set these via the Heroku CLI:
heroku config:set NEW_RELIC_LICENSE_KEY=<YOUR LICENSE KEY> NEW_RELIC_APP_NAME=<YOUR APP NAME>You can get your license key from the New Relic web app. Your application name can be whatever you want — it’s used to identify your service within the New Relic UI. If you intend to use New Relic in any pre-production environments (which I recommend) then it’s a good idea to naming convention that includes the environment. For example, “Recommendations Service [STAGING]” and “Recommendations Service [PROD]”.
Check that New Relic and Java are working
Once you’ve deployed these changes into an environment (or run your service locally with a valid license key) you should see your service show up in the New Relic application list within a minute or so. Clicking on that application will take you to the Monitoring Overview screen, where you’ll see basic trend data for things like request throughput and latency. You’ll also see a list of running hosts, along with trend data for CPU, memory, and so on.
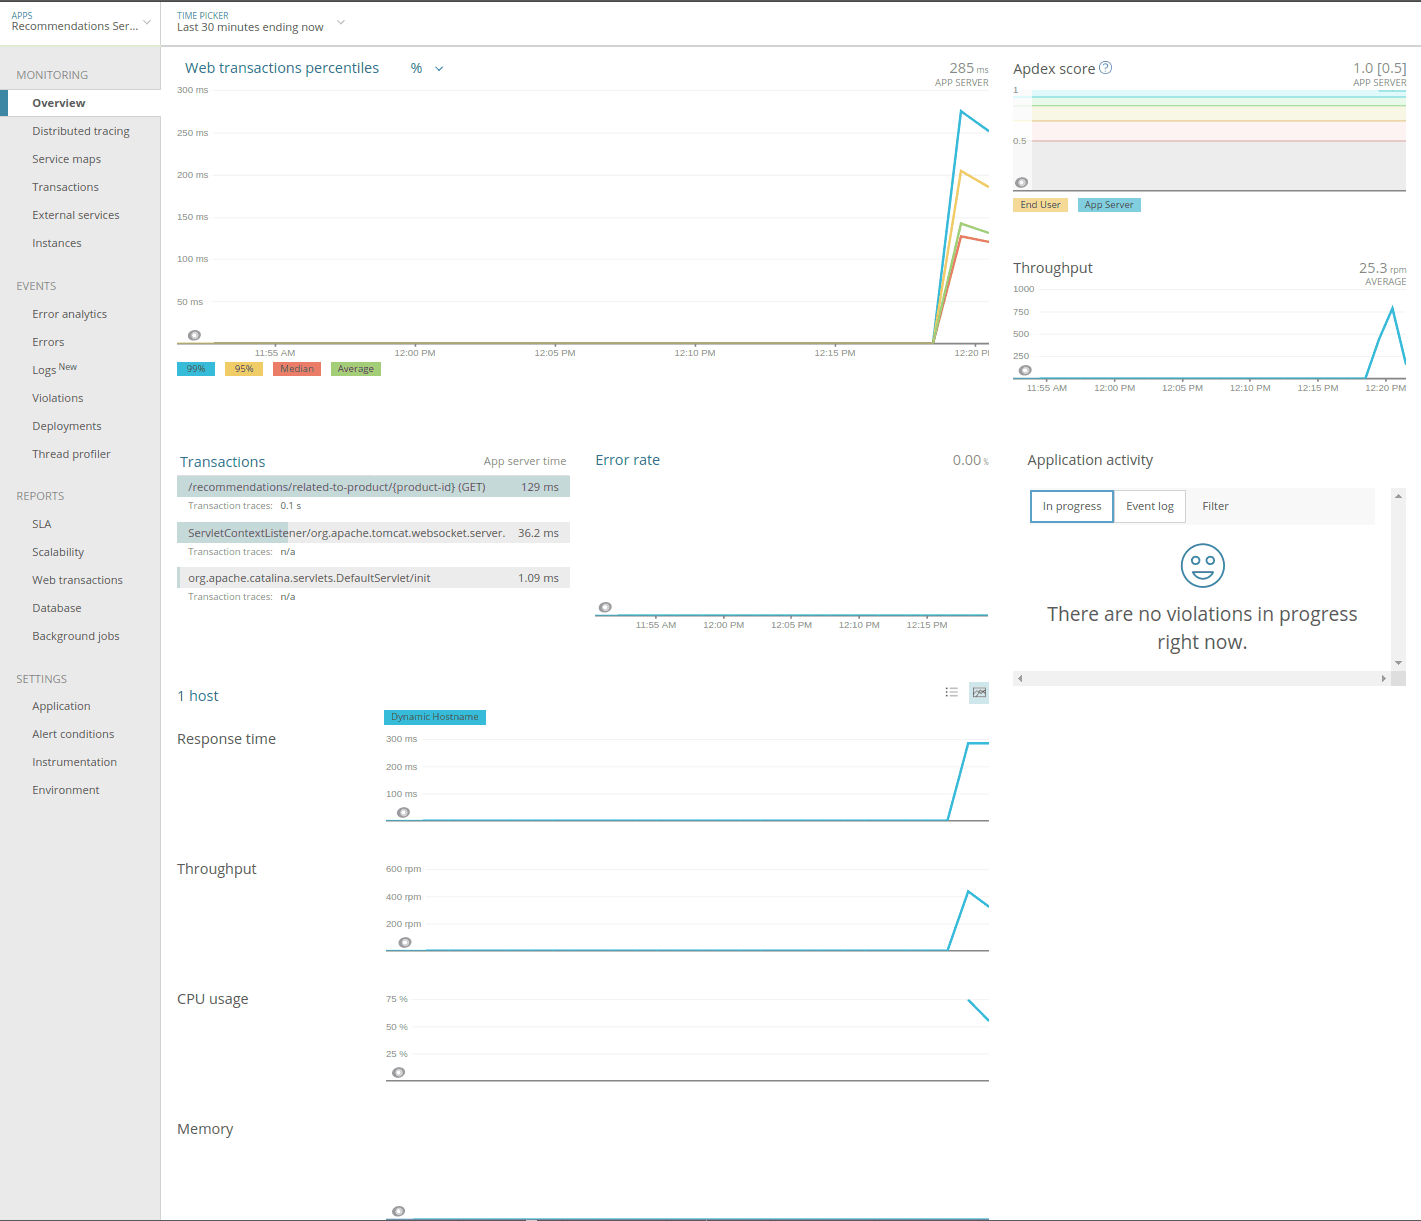
Congratulations, you’ve set up New Relic monitoring for your Java service!
Get Visibility into Production on Your Java Web Service with New Relic
We’ve seen in this article how easy it is to get basic New Relic monitoring in place for your Java services — we didn’t even have to touch a single line of code. With that monitoring in place, you’ll be able to gain visibility into how your services are performing at runtime and be able to answer those What, When and Why questions in response to a production incident.
There’s a lot more that you can do with New Relic beyond the basic monitoring we set up here. Something that’s particularly powerful is the ability to add custom instrumentation. We touched on that in our example incident, where we were able to push context about Split feature flags into New Relic, and then slice and dice our metrics based on that information. We’ll show the details of how to set that up in a future post.
Summary
New Relic uses an agent-based monitoring approach, which means you don’t need to make any code changes at all unless you want to use advanced features like custom instrumentation. We can pass configuration to the New Relic java agent in various ways within the New Relic web app. Once you’ve deployed these changes into an environment you should see your service show up in the New Relic application list within a minute or so.
Learn More About Monitoring, Experimentation, and Feature Flags
Interested in digging deeper on how to add feature flags and experimentation to your Java app? We’ve got you covered:
- Check out our Java docs
- Read about using Split for quick and easy feature flags in Java
- Get even more data-driven with mParticle and Split
- Learn how you might not need continuous deployment
- And finally, check out the state of feature delivery in 2020
As always, if you’re looking for more great content like this, we’d love to have you follow us on Twitter @splitsoftware, and subscribe to our YouTube channel.
Get Split Certified
Split Arcade includes product explainer videos, clickable product tutorials, manipulatable code examples, and interactive challenges.
Switch It On With Split
The Split Feature Data Platform™ gives you the confidence to move fast without breaking things. Set up feature flags and safely deploy to production, controlling who sees which features and when. Connect every flag to contextual data, so you can know if your features are making things better or worse and act without hesitation. Effortlessly conduct feature experiments like A/B tests without slowing down. Whether you’re looking to increase your releases, to decrease your MTTR, or to ignite your dev team without burning them out–Split is both a feature management platform and partnership to revolutionize the way the work gets done. Switch on a free account today, schedule a demo, or contact us for further questions.