
Here at Split, we are always investing in ways to help our users be more data-driven when they are making decisions around their feature releases. Our new data integration with mParticle allows our users to do exactly that via easily integrating mParticle and Split into your current data workflow.
What is mParticle?
mParticle is a customer data platform that allows you to centralize, manage, and activate your customer and engagement data across any channel. You can use Split’s mParticle integration as a feed input and when configured, Split will send traffic impression data for splits to mParticle. This feed integration can be particularly useful when validating impression data in your current data workflow or if additional analysis is required.
What Can I Do with mParticle and Split?
The mParticle integration also includes Split as an event output. When configured, Split will quickly process and display mParticle event data in the Split platform for analysis. Once the event data is in Split from mParticle you will be able to build a wide range of metrics using mParticle events, including count, sum, average, percentage. After these metrics are created, you will be able to easily see the impact that your feature flags are having on your business metrics. Note, all metrics will be automatically calculated for all the splits in your workspace. You can also create metrics after a split has started, and we will calculate the impact of these metrics retrospectively providing the events have already been sent to Split.
Split accepts custom, product action, session start, session end and screen view events from mParticle that have either been sent directly from mParticle or from other tools you may have integrated with mParticle such as Zendesk or Sendgrid.
The majority of mParticle event fields that Split will receive will be mapped to the event property bag within the event in Split. This gives you the opportunity to create a range of extensive and granular metrics in the metrics definition builder in Split using these event properties in different ways in the metric definition. Here’s an example:
{
  "id": "TinDWw2v2i0wTf0OQf4DIe469",
  "eventTypeId": "product_action",
  "organizationId": "4d3405a0-9ca5-11e5-9706-16a11fb02dec",
  "environmentId": "4fbab080-9ca5-11e5-9706-16a11469421",
  "environmentName": "Production",
  "trafficTypeId": "3237f220-131f-11e6-aaed-1e4e01864f1b",
  "trafficTypeName": "user",
  "key": "f9f34a80-5a52-11e9-a716-12a5cc2af8fe",
  "timestamp": 1578431828598,
  "value": 0,
  "source": "mParticle",
  "foreignId": "ajs-3c59feff1f3df09f4fbd54d49ca96296",
  "properties": {
    "action": "add_coupon_code",
    "transaction_id": "07835772010",
    "total_amount": 300,
    "product.coupon_code": "summer_vacations",
    "session_id": "1583186469421",
    "source_message_id": "028469421"
  }
}mParticle and Split, an Example
Let’s go through an example of how you could utilize the event output integration. You own a hotel website where your event tracking is already being sent to mParticle. There is currently a promotion on your website for a discount on summer vacations. You want to experiment with different versions of the promotion page to determine which variant is most effective at driving coupon code use at checkout. For this experiment, you want to be able to measure the percentage of unique users who apply the promotion coupon code at checkout.
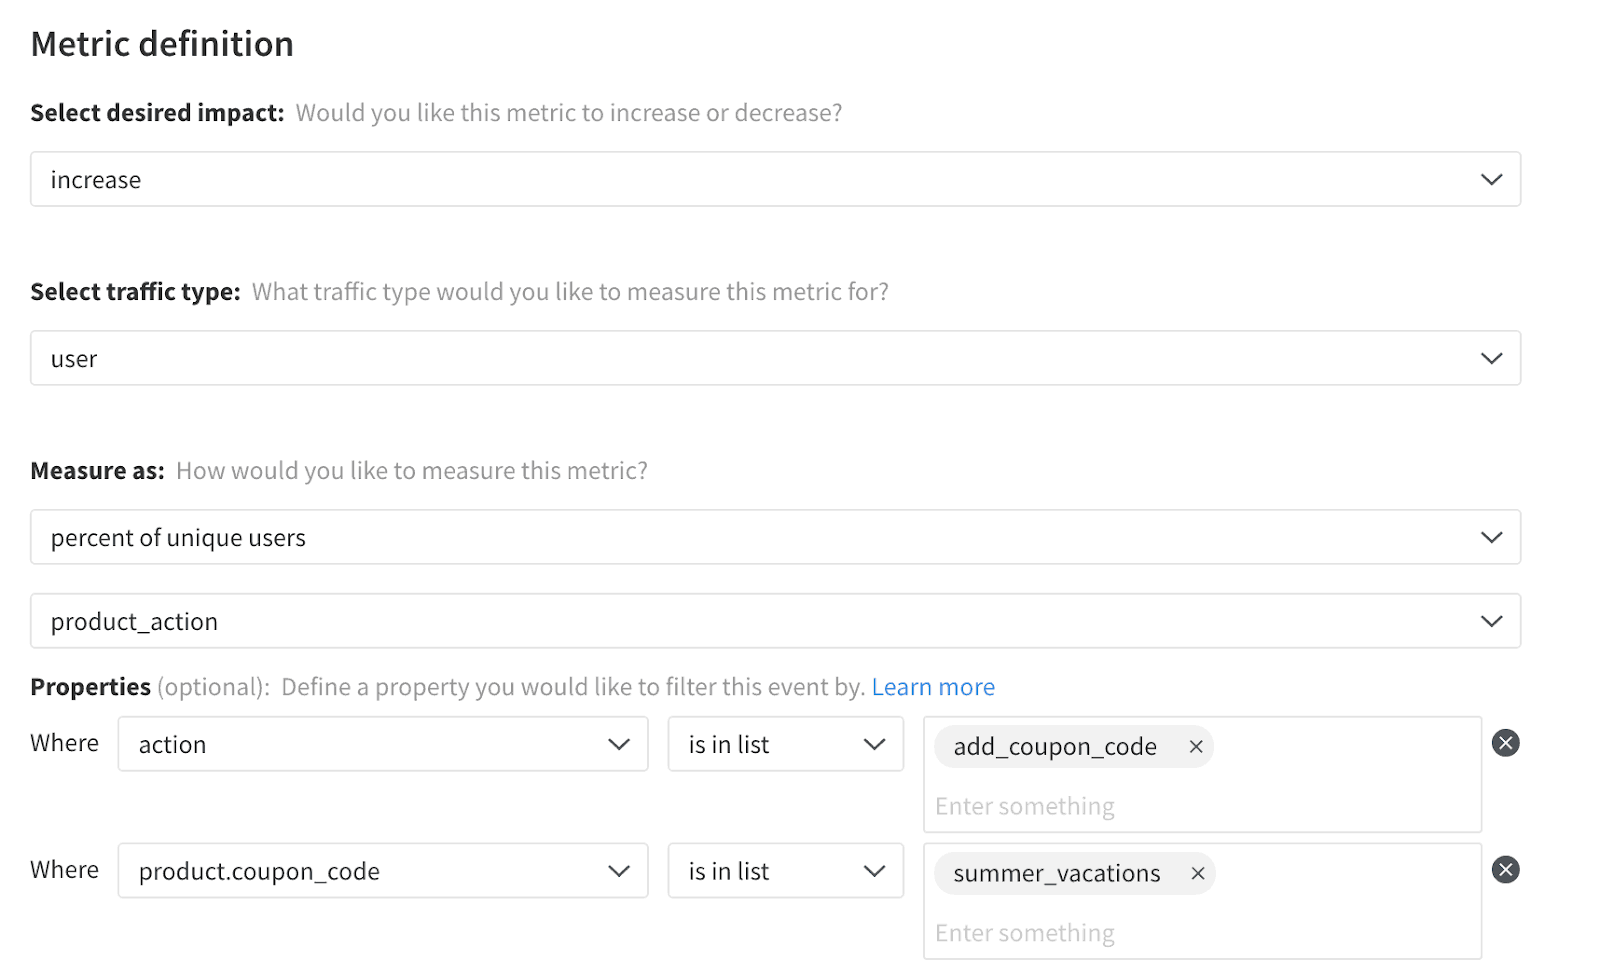
When a user applies the coupon code at checkout, an event is generated in mParticle called product_action and is then passed to Split. You will then be able to create your key metric as shown below:

You will need to filter this metric down to just the product_action of applying the discount for the summer_vacations promotion at checkout, this can be achieved through the event property filters as shown below.
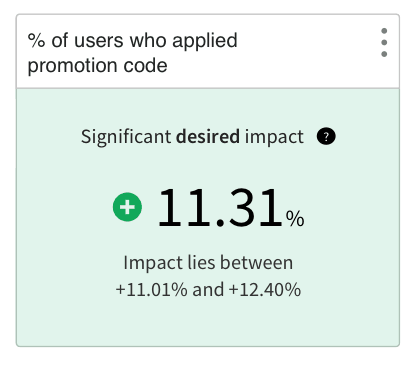
When this metric is created, we will automatically begin calculating this for your experiment. Once your experiment has been running for a full business cycle, or experimental review period (we recommend 7 or 14 days), you will be able to determine if any version of the promotion page drove statistically significant results. If statistically significant results in the desired direction were achieved, it will be shown in the Metric impact tab as shown below:
And that’s it! It’s simple and powerful, and you can deploy with Split and mParticle today!
Learn More about Split Data Integrations and How to Utilize Event Data in Split
Here are some more resources on the topic:
- mParticle user documentation
- Using event properties in metric definitions
- Using event data for feature monitoring
- Understanding metric trends and details
- Build high-performing feature with Google Analytics and feature flags
And as always, for more great content follow us on Twitter @SplitSoftware, and subscribe to our YouTube channel.
Get Split Certified
Split Arcade includes product explainer videos, clickable product tutorials, manipulatable code examples, and interactive challenges.
Switch It On With Split
The Split Feature Data Platform™ gives you the confidence to move fast without breaking things. Set up feature flags and safely deploy to production, controlling who sees which features and when. Connect every flag to contextual data, so you can know if your features are making things better or worse and act without hesitation. Effortlessly conduct feature experiments like A/B tests without slowing down. Whether you’re looking to increase your releases, to decrease your MTTR, or to ignite your dev team without burning them out–Split is both a feature management platform and partnership to revolutionize the way the work gets done. Switch on a free account today, schedule a demo, or contact us for further questions.