
New Relic can provide powerful insights into your system’s performance, way beyond the basics of monitoring response times and error rates. You can add custom instrumentation, allowing you to track metrics and metadata specific to your application — such as feature flag impression data. You can also use New Relic Insights to perform sophisticated analysis, grouping, filtering, and aggregating by arbitrary facets of the time-series data that New Relic collects.
With feature flags via Split you can use these capabilities to “close the loop” for feature rollouts. By pushing feature flagging metadata into New Relic, you can now understand the impact of a feature change across any metric you care about, in real time. In this post, we’ll see how.
Explore Data with New Relic Insights
New Relic provides a product called Insights, which provides centralized access to all the time series data generated across the New Relic ecosystem. You can perform ad-hoc analytics and create custom visualizations across that data, using a special-purpose query language called NRQL.
Insights lets you slice and dice instrumentation coming in from your systems in many ways. You can aggregate or “roll-up” a metric, to see things like how median and p95 response times are trending over time, a histogram distribution of response times, or a trend of error rates over time. You can also filter and group by metrics, to see individual response time trends for each server instance, or error rate trends for one specific request path.
What makes Insights extra powerful is that you can do these operations against custom properties in exactly the same way. This means you can do things like track error rates for specific customers, or track average shopping cart size over time.
If you’re using Split in your Java application it’s very easy to set up an integration with New Relic which will push feature flag state directly into the Insights data store. This allows you to easily understand whether a feature flag is impacting things like error rates or response times.
Surface Feature Flag State Within New Relic
Enabling Split’s rich New Relic integration in a Java application is really straightforward. Here’s a before and after:
Before
SplitClientConfig config = SplitClientConfig.builder()
    .setBlockUntilReadyTimeout(10000)
.build();After
SplitClientConfig config = SplitClientConfig.builder()
    .setBlockUntilReadyTimeout(10000)
    .integrations(
        IntegrationsConfig.builder()
        .newRelicImpressionListener()
        .build())
.build();With that simple change made we’re now sending Split impression data into New Relic. Now let’s see how we can work with that data.
Monitor a Feature Flag Rollout with New Relic
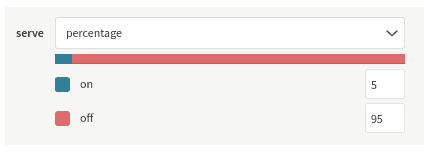
Let’s say I have a feature flag called next-gen-recommendations. We want a controlled rollout of this feature, so I’ve turned it on for just 5% of users initially:
I can now go over to New Relic and check that some requests are indeed being served with the flag on:
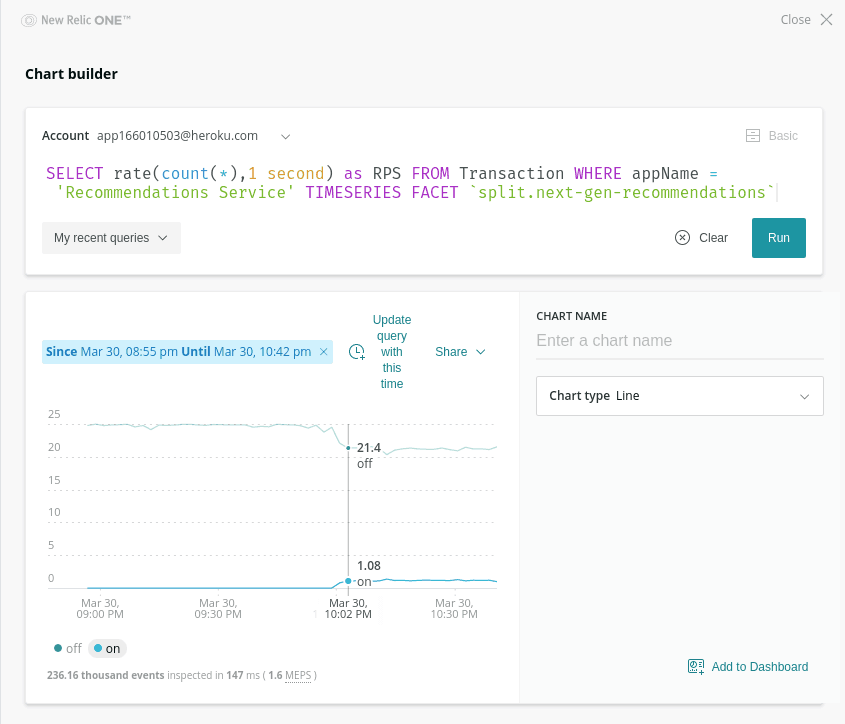
Here I’m generating a trend graph showing requests per second, grouped by the state of that next-gen-recommendations flag. You can see that starting around 10pm a small number of requests start coming in with the treatment on, just as we’d expect given that we’re starting with 5% of users.
I can also take a look at whether the feature flag has any impact on response time by rolling up response duration by p95 percentile, again grouping by the state of our feature flag:
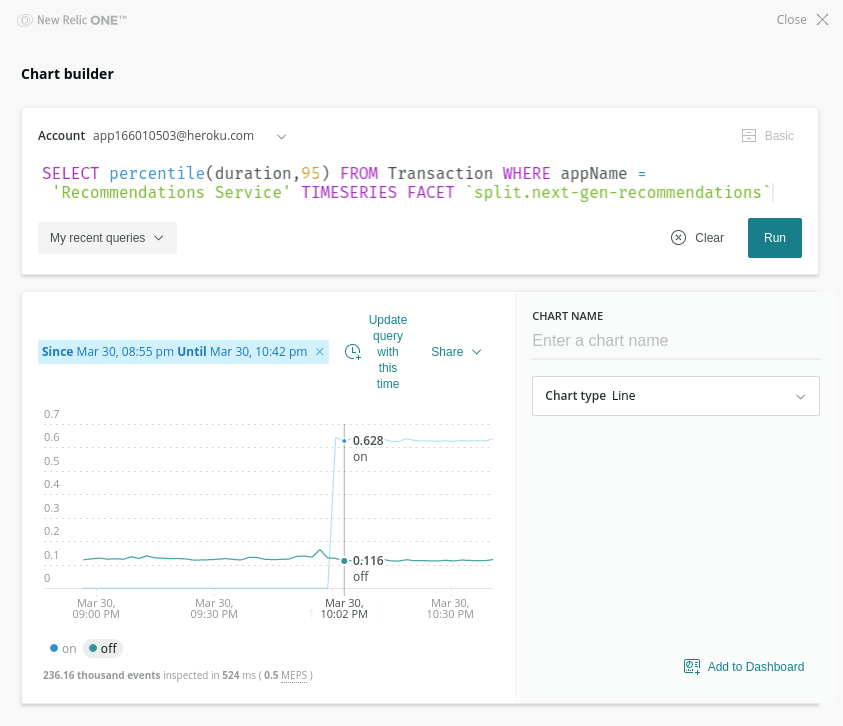
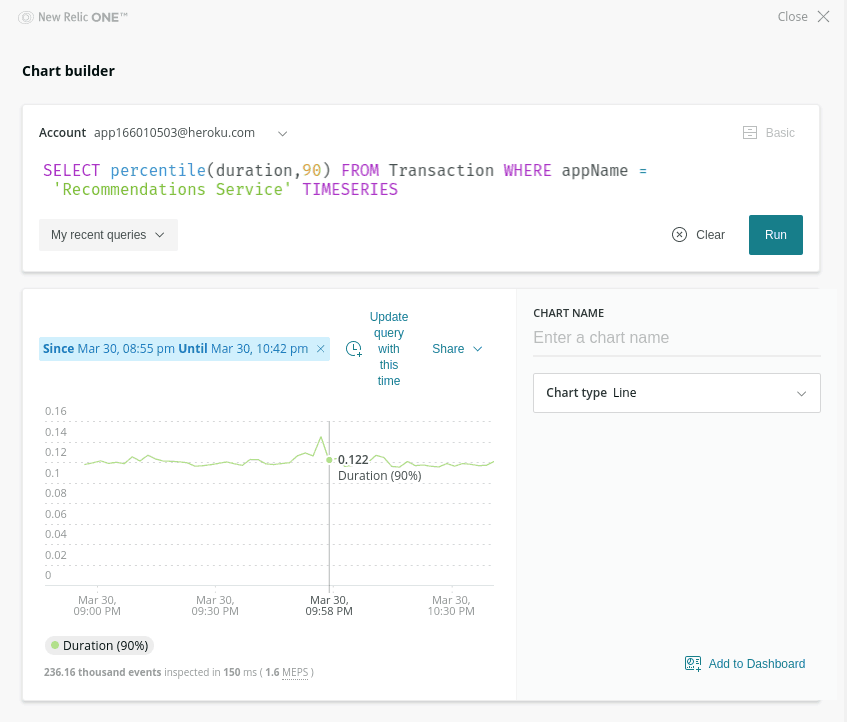
Ruh-roh — looks like something is going wrong! Requests that have the treatment on have a noticeably higher response time — around 600ms with it on vs around 100ms with it off. Luckily, this has only impacted that small 5% canary cohort so far. In fact, if we look at the overall response time (without grouping by that feature flag) we can’t detect any significant impact:
At this point I can hop back over to Split and safely turn the feature back down to 0%. Engineers can then take their time to figure out exactly what was the cause of that extra latency, outside the pressure and stress of a live production incident.
Close the Feature Rollout Loop
This example shows why it’s so powerful to have feature flag state available alongside performance metrics — when we can correlate flag state with other metrics we’re able to close the loop on a controlled rollout, detecting the negative impact of a change very early, before most users even experience it.
Closing the feedback loop in this way lets you fully leverage your investment, both in feature flagging and in instrumentation and monitoring.
Learn More About Monitoring, Controlled Rollout, and Feature Flags
Interested in digging deeper on how to integrate monitoring into your feature flag situation? We’ve got you covered:
- Learn how to get New Relic and Split set up in your Java application
- Check out another way to integrate feature data, using mParticle and Split
- Read more about the importance of correlating cause and effect in this free Feature Flag Best Practices eBook
- Learn about the path from Continuous Delivery to Continuous Experimentation
- And finally, check out the state of feature delivery in 2020
As always, if you’re looking for more great content like this, we’d love to have you follow us on Twitter @splitsoftware, and subscribe to our YouTube channel.
Get Split Certified
Split Arcade includes product explainer videos, clickable product tutorials, manipulatable code examples, and interactive challenges.
Switch It On With Split
The Split Feature Data Platform™ gives you the confidence to move fast without breaking things. Set up feature flags and safely deploy to production, controlling who sees which features and when. Connect every flag to contextual data, so you can know if your features are making things better or worse and act without hesitation. Effortlessly conduct feature experiments like A/B tests without slowing down. Whether you’re looking to increase your releases, to decrease your MTTR, or to ignite your dev team without burning them out–Split is both a feature management platform and partnership to revolutionize the way the work gets done. Switch on a free account today, schedule a demo, or contact us for further questions.