No matter how rigorously a development team operates or how robust a quality assurance process exists, errors and exceptions are an inevitability for any software application. They may result from an edge case in the logic, unexpected customer input, or a bad state in some hardware component; however, they might surface they typically result in a poor customer experience. By measuring when and where errors occur, developers have the tools in hand to react to and resolve those issues. When those teams can combine feature data with those errors, they can achieve faster identification, response, and resolution.
Event Tracking
Errors occur throughout the stack and application. On the web, the typical sources of errors are thrown exceptions and failed network calls. There are certainly other cases where errors can be captured or explicitly tracked, though they will operate very similarly in terms of metric design.
Exceptions
Uncaught exceptions are among the most straightforward errors to track as they are bubbled up to the top level of the logic and can be caught by the onError event they trigger. Simply looking for a change in error rate will provide the signal needed for developers to dive into the exceptions thrown and correlate them with the feature change. Still, it is helpful to also track the related stack trace to create metrics around errors in a particular technology or module of the code.
Request Error
As the client triggers requests back to the server, those requests may return with a wide variety of status codes relating to issues with either the inputs or the server itself. Requests are a very high volume source of traffic, so tracking an event on each request, even each failed request, can be very noisy – but limiting tracking to specific request paths or status codes and aggregating errors together over a period of time can provide a helpful signal for when a new feature is calling an endpoint which is responding improperly. Associating the current page’s errors and providing request details such as the service hit, request type, or error code can provide helpful context for metric development.
Metrics
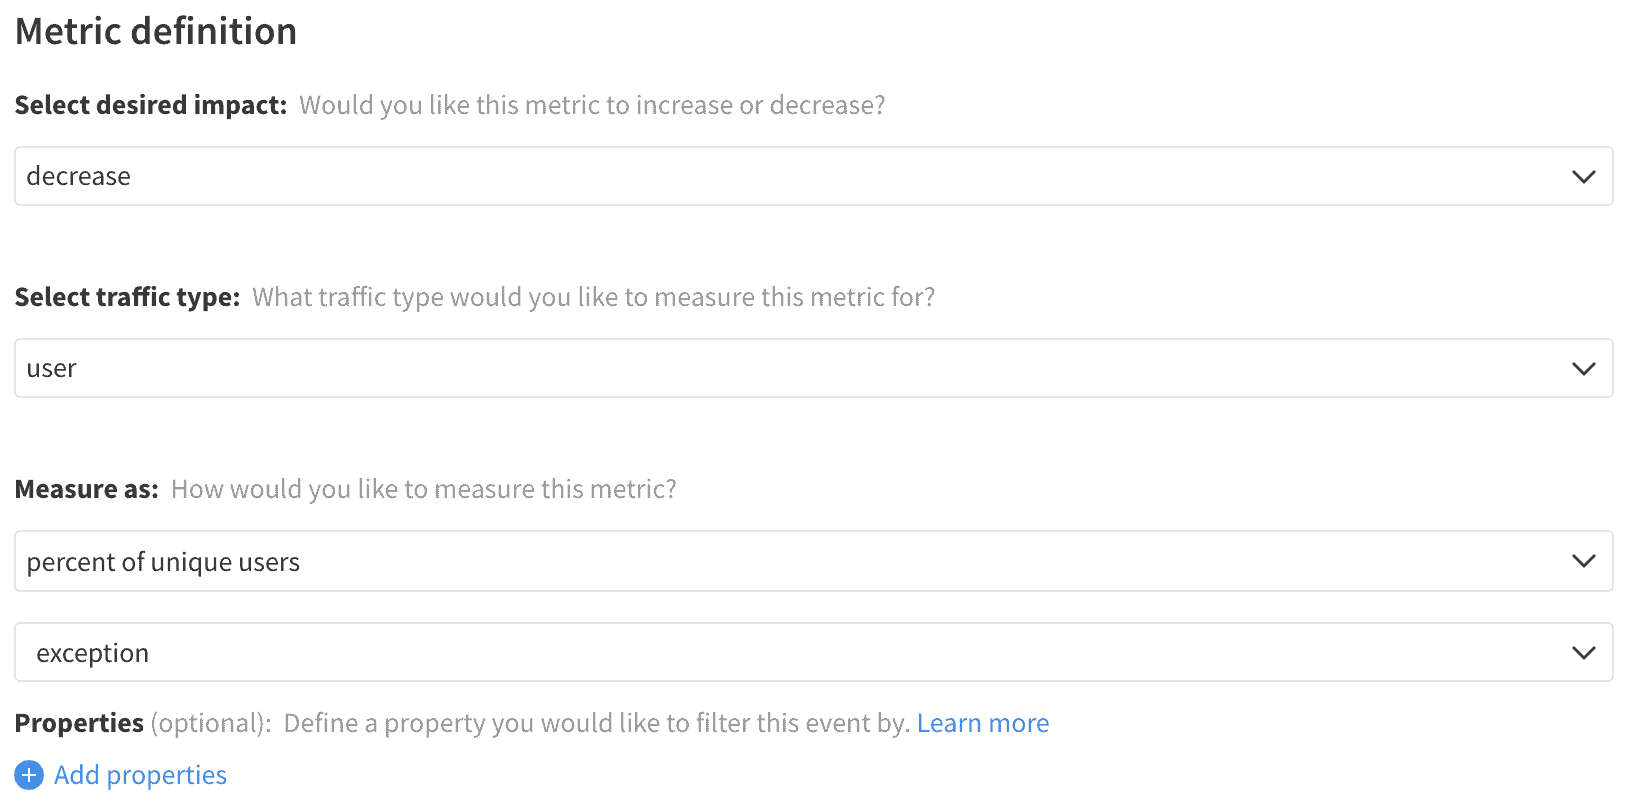
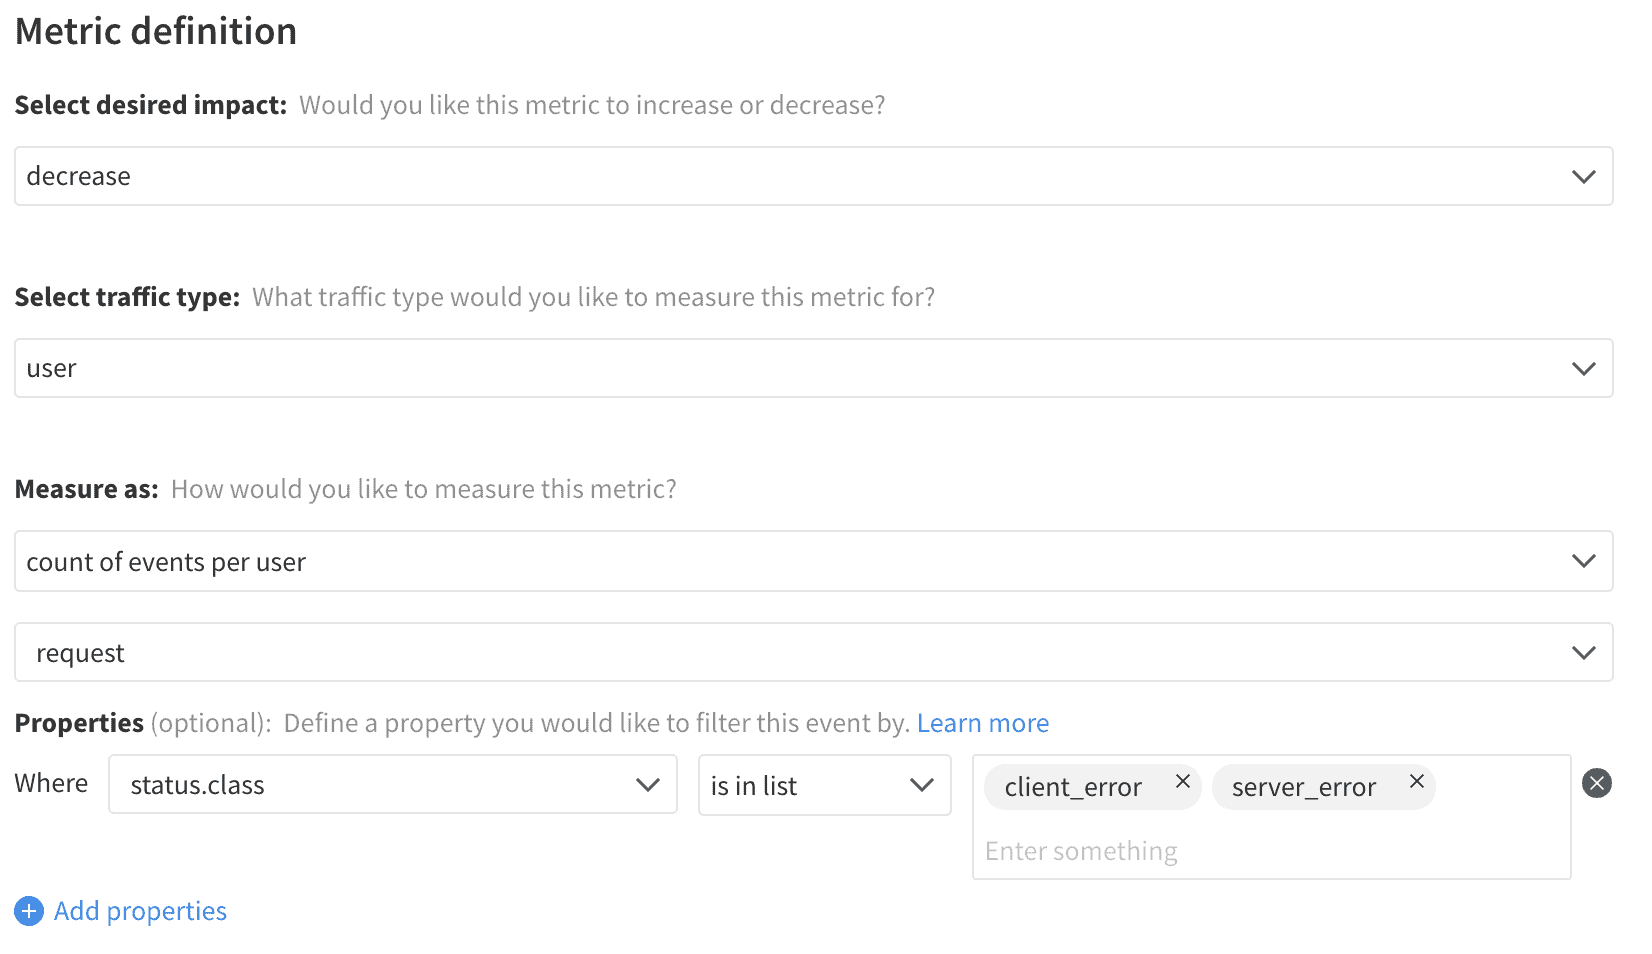
For all kinds of errors, there are typically two primary measurements that are valuable to monitor. The error rate will measure the percentage of users who encounter an issue, allowing the team to identify the spread of an issue. Tracking total errors provides how often the issue occurs and can show the issue’s frequency or magnitude. Those two points can be combined to help surface how serious a problem and structure the response.
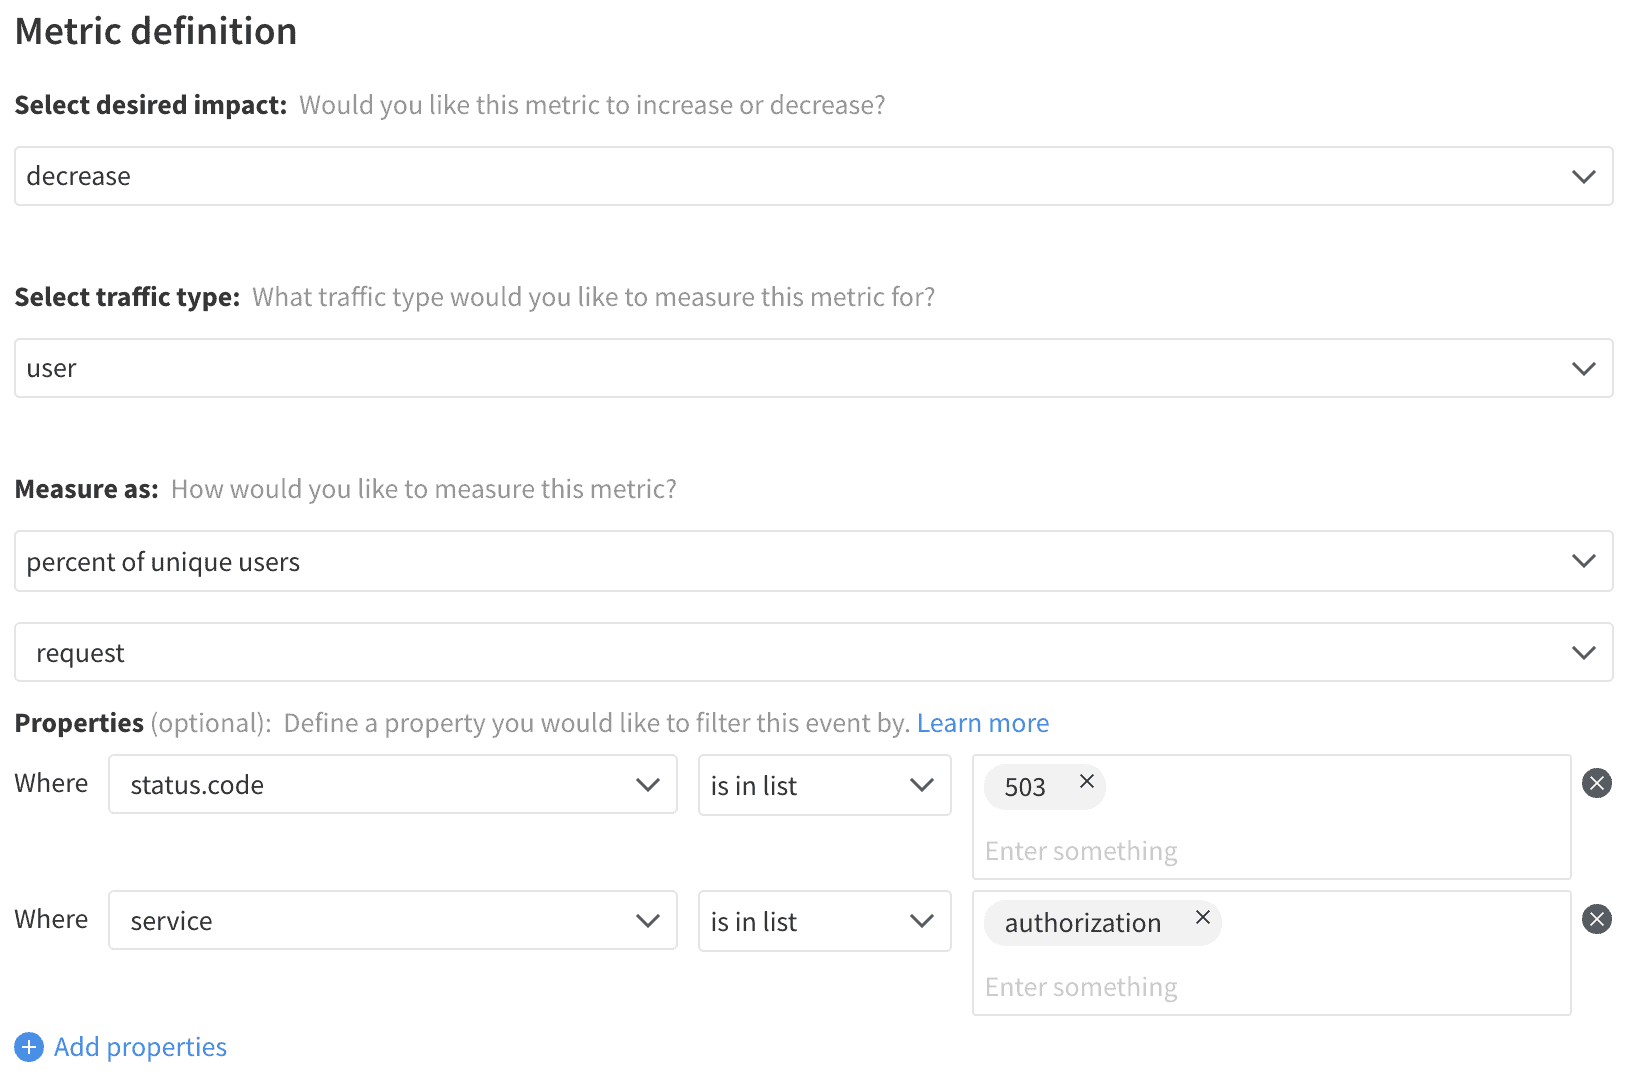
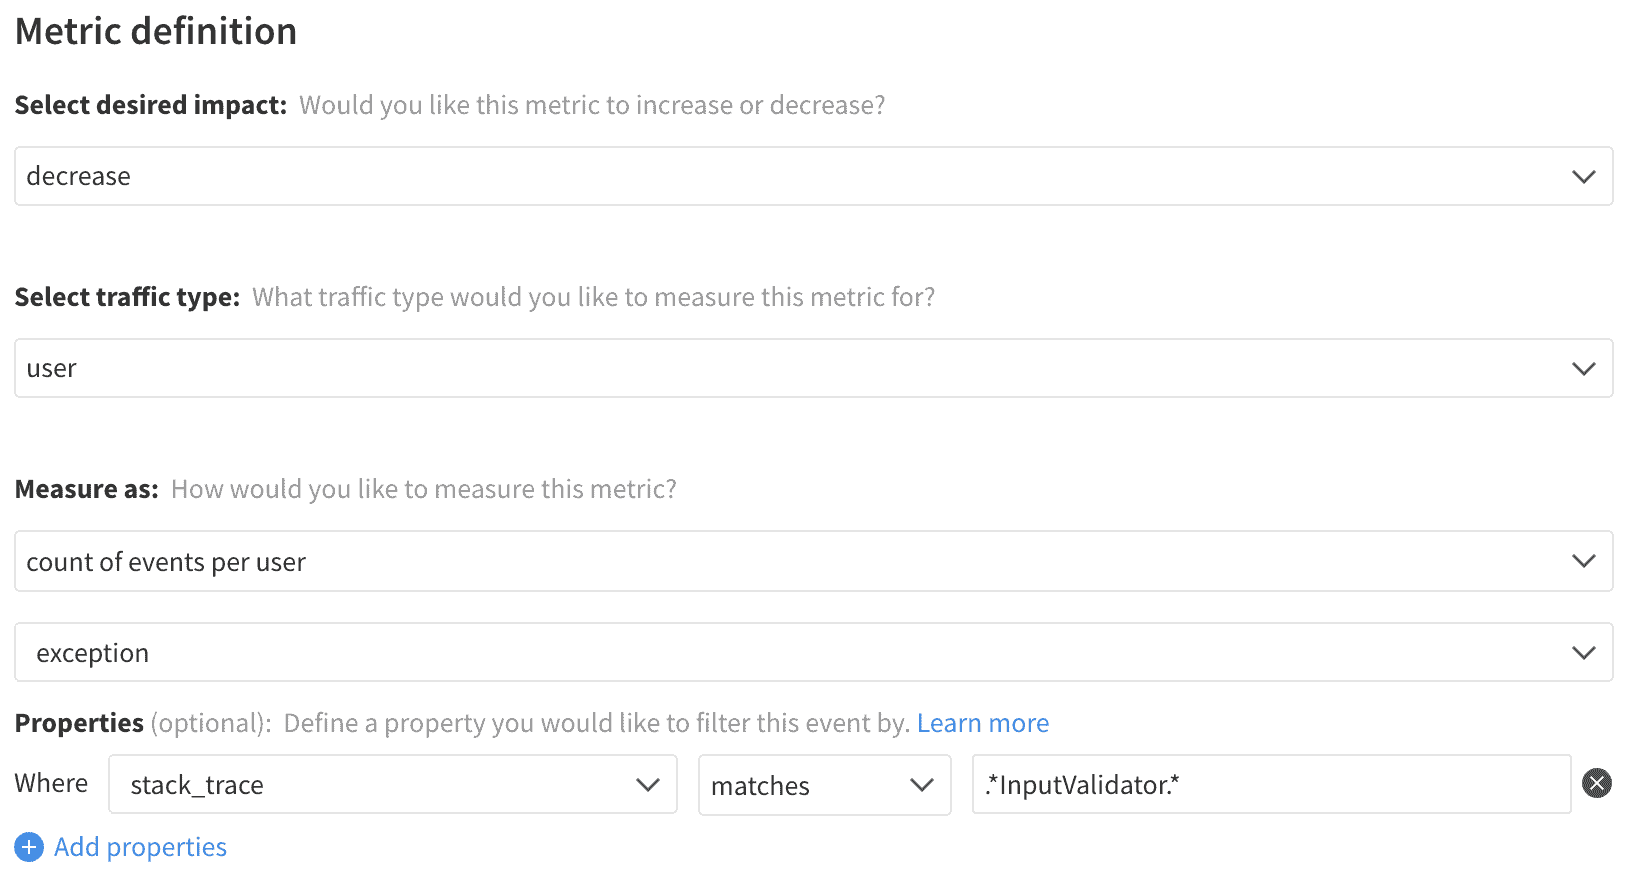
Each of these metrics can be filtered to look for particular kinds or sources of errors. While there are a wide variety of ways to isolate and filter these metrics, provided are examples for filtering the stack trace to find errors from a particular module and for filtering requests by service and code.
Error Rate

Error Rate – Service and Status Code

Total Errors

Total Errors – Module
