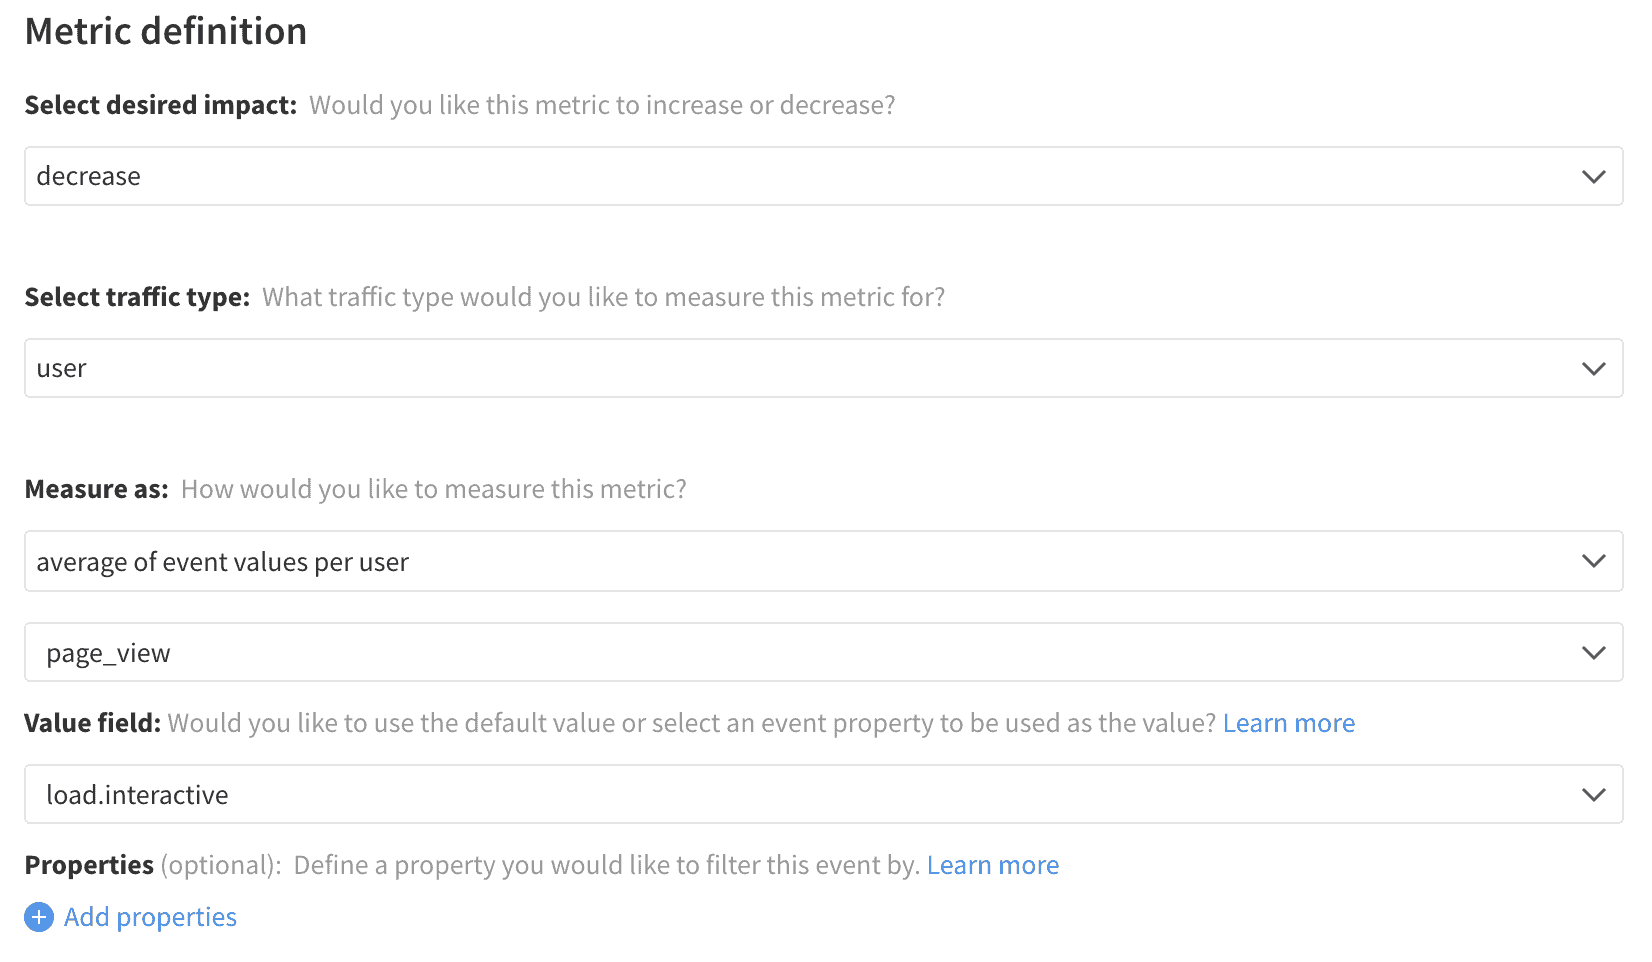
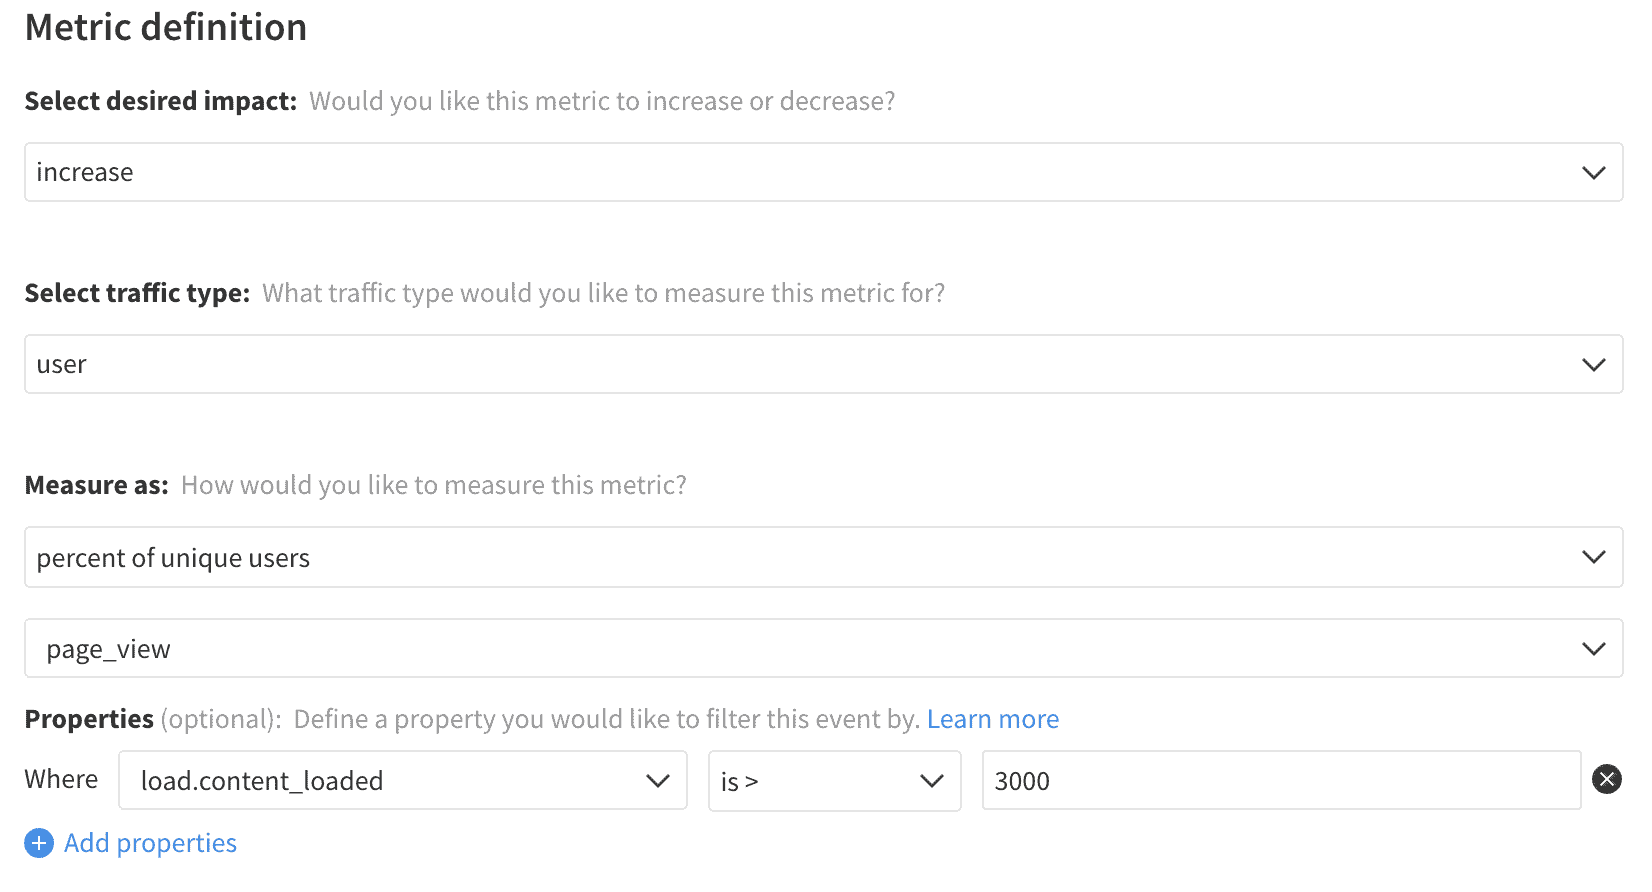
Page load time refers to how long it takes for a page to show up on the screen. Timing starts when a customer initiates a page transition by clicking a link or typing a URL into your browser and ends when the page fully loads. Modern browsers offer a Navigation Timing API, but this assumes navigation starts and ends with the page’s loading.
Many web frameworks implement a single-page application architecture that navigates by loading assets in and out from the existing page. So in those cases, the load times will also want to be tracked from those state changes. It is also worth noting that there are several stages to the progression of a page load. The browser first retrieves assets, then rendering the page, and finally reaches an interactive point where the application is usable. Each of those timings can be useful when measuring performance and should be tracked accordingly.
A wide range of factors influence this metric. Those within the developer’s control are the size and number of assets on the page, the complexity of the rendered document, and the time required for any server-side operations that need to be executed. While a user’s connection speed and hardware influence this metric on an individual basis, product changes that impact this metric will affect users across the board.
Improving page load time is critical for all businesses. Delays in page load time have been shown to cause significant reductions in conversion rates and page views. Google has long used site speed as a factor in its page ranking algorithm. Google’s research has also shown that slow-loading pages have a considerable increase in bounce rates.
Page load time is most commonly leveraged as a guardrail metric, allowing you to keep track of whether a change negatively impacts performance for users. New features might add expected extra latency to a page load, but even in those cases, it is vital to measure the degree to which they impact load times. Bugs or poor technical design can add significant delays unintentionally, which should be fixed before more widespread rollout. In some cases, refactors, bug fixes, or performance work can be focused on improving page load times as a key metric, and we suggest a few ideas for changes that can improve this metric for your consideration below.
Event Tracking
Performance measurements for web pages can typically be consolidated into a single page load event, fired once navigation completes. In certain advanced use cases, it may be preferable to send multiple events for each type of timing measurement to capture that performance in cases where a page fails to load or is exited before loading completes. Checking for those stage completions and ensuring the prompt sending of events can result in additional latency to the page load.
Page Load
With simple websites, tracking of page load performance is as simple as triggering an event when the load completes and then using the data from the Navigation Timing API to extract the various load timings. In single page architectures, it may be possible to use the MutationObserver or Resource Timing APIs to track subsequent navigation transitions. Still, most frameworks make available hooks that can measure the start and completion of page transitions.
For these transitions, the event should include property values for any timing measurements relevant to the final performance metrics and use additional properties for further slicing of those metrics to provide deeper insights. These properties include the loaded page of the site (either by passing the URL or some other key identifying the page), connection information that might influence the page performance, and whether the page had been previously visited during the session (as caching can significantly change page load performance).
This data collected by the page load event carries a lot in common with a page view. Data regarding the frequency and number of fired events are better suited for that context of a user navigating the product. The Split reference application combines the page load performance properties into the page view event for the sake of simplicity.
Metrics
Metrics associated with loading the page are covered in detail within the page view metrics section of this reference. When focusing on page load performance specifically, the critical value for consideration is the average page load time. This page performance often has quite a broad variability, given the number of unique factors that can influence page performance, so a more direct view of the data is to establish a fixed SLA for page performance and then to measure how often that SLA is violated through the Page Load SLA Failures metric and the percentage of users experiencing such issues with the Page Load SLA Exposure metric.
For any of these metrics, the time calculated by this metric can be any of the several possible navigation timings available. It is common to implement several metrics to identify performance issues impacting a specific part of the performance. It is also valuable to create separate metrics tracking performance on different areas of the site or with varying speeds of connection to understand better where bottlenecks might occur.
Average Page Load Time

Page Load SLA Failures

Page Load SLA Exposure
