When an application fails to perform as a user expects, it causes a negative experience that sticks with that user. The frustration may be caused by slow performance, broken functionality, or simply by a design that looks like it should act one way but does not do so. We may not capture that the user is yelling at the screen, but a typical behavior that occurs in this situation is rage clicks – rapidly repeated clicks on an element or area of the screen. By capturing when this happens, you can quickly identify and respond to those areas of user frustration that may not ever be reported directly by your customers through regular feedback channels. When measuring your feature releases, looking for a change in rage clicks will help identify if the feature is behaving as intended or if elements of your user experience are negatively impacting your customers.
Event Tracking
A rage click is a special case of a click event but requires additional logic to track properly. The application will need to maintain an internal state that gets updated with each click, tracking the number, location, and frequency of clicks that have happened recently. While we will cover the core concepts here, a technical implementation reference is available as part of the click tracking logic in the Split reference application.
Rage Click
The challenge in correctly identifying rage clicks is that there are plenty of cases where rapidly repeated clicks are normal behavior. The user may be double-clicking on an element out of habit. They may be selecting a word or line of text or interacting with a navigation element such as paging through data. Proper rage click tracking should tune the click speed, count, and location thresholds appropriate for your product. A highly restrictive tuning risks failing to identify frustration, while a very loose definition will cause false positives.
When implementing rage clicks, make sure to only fire one rage click event for a given incident (rather than one per click), and include information like the page and element involved in the click for targeting metrics or even future debugging of why the frustration occurred. It is also worth considering whether your product would best take advantage of looking for repeat clicks on a single element or tracking the clicks that are simply within a small distance of one another.
Metrics
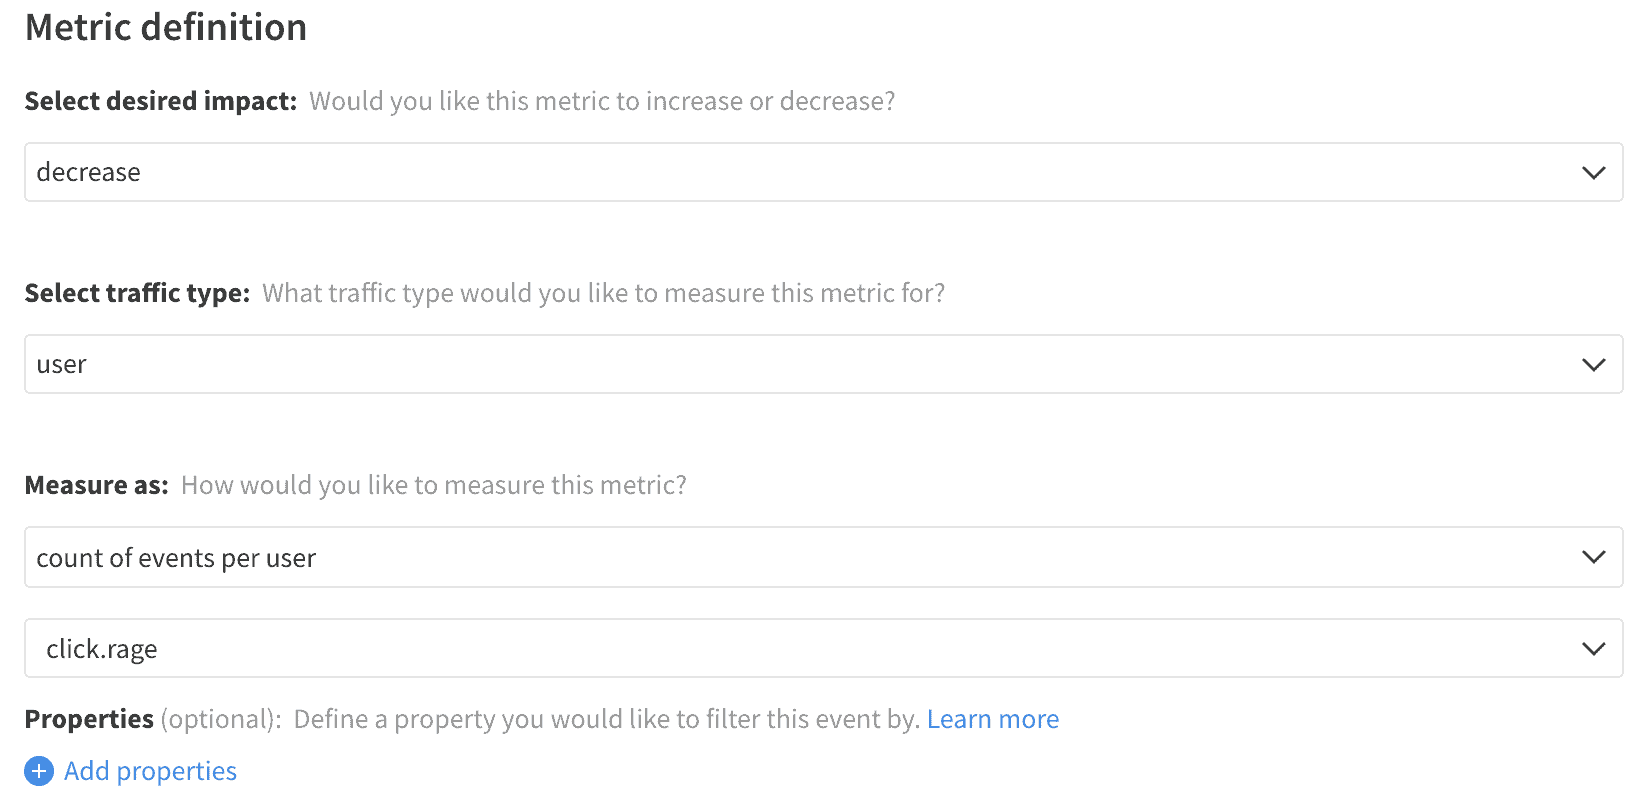
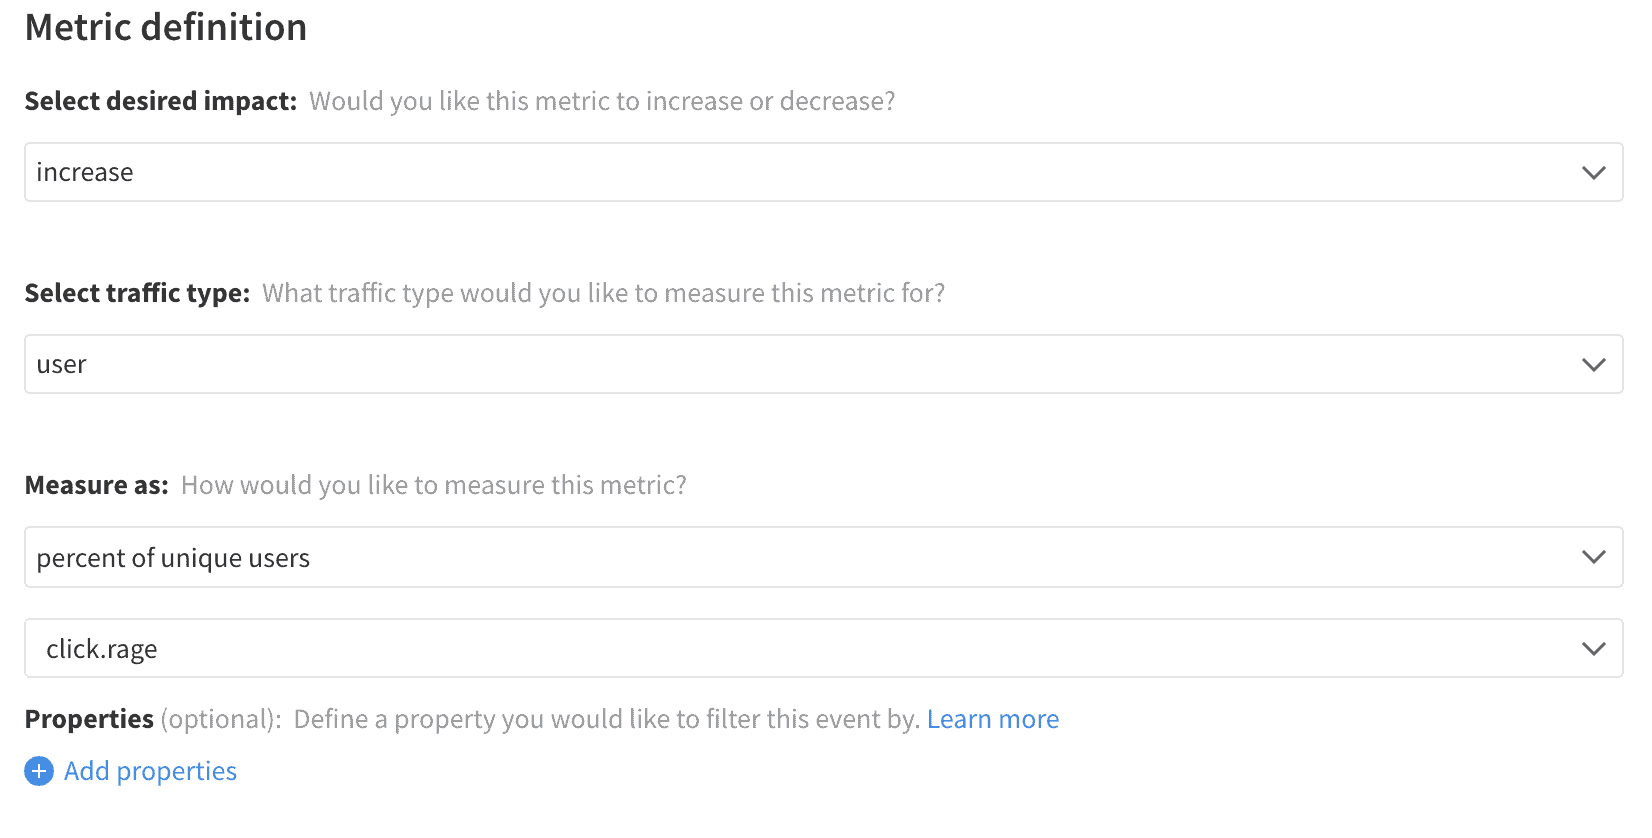
While it may be tempting to simply track the rage click count of the customer base, rage clicks are an infrequent occurrence in most products. Hopefully, most of your users will never trigger a rage click event, in which case the number of rage clicks will be a low sensitivity metric. It helps augment that metric with a measurement of the frustration rate, the percent of users who trigger any rage clicks, as this metric will capture the scope of the frustration and is typically a more sensitive metric.
For more advanced use cases, creating related metrics isolated to specific areas of the application using property filtering on the frustration events can provide better guidance as to where the issue is occurring. Still, it is also helpful to extract that set of events in an export and look for patterns in the underlying data unrelated to the active experiments.
Rage Click Count

Frustration Rate
